
Beyond the Whale Tales
Myth-busting Docker performance for ROS 2 with real benchmarks


If you work in development—especially in hardware or real-time domains like robotics—you’ve probably heard the usual refrains: “Docker is slow” “Real-time is impossible in containers” “Networking latency is much higher” and so on.
After graduating, I joined a fleet-management company deploying containers on IoT devices. By the time Docker became part of my daily toolkit, I knew how to make it work—so the “Docker is slow” line never matched what I saw. Yet in the ROS and robotics world I still see hesitation, despite clear gains: reproducible dev environments, reliable OTA, simpler ops, and more robust, predictable systems.
I set out to test the myths with a set of benchmarks. I expected modest overhead—some slowdown, higher latency—and assumed the gap would widen under load in native’s favor, especially on modern machines.
Boy, was I wrong. I reran the tests, controlled variables, and even rewrote parts of the suite. The results seemed too good to be true. After a deep dive into the Linux Completely Fair Scheduler (CFS), the patterns—and the data—finally clicked. A small spoiler: in some cases, containerized ROS 2 applications outperform their native counterparts.
Join me for the deep dive, and let’s see how adopting containers in robotics can improve your workflow and boost the robustness and predictability of your systems, especially under high load.
What do you mean by slow ?
The first challenge was figuring out how to quantify the myth. I wanted to tackle most of the common claims about Docker in robotics, but I narrowed the scope to speed, real-time behavior, and hardware access. What does “slow” actually mean? Is it CPU-bound runtime, end-to-end latency, reduced throughput, or degraded file I/O? Before testing, I had to pin down the metric.
Robotics applications are computationally heavy—SLAM, motion planning/kinematics, sensor filtering and fusion, computer vision—but the biggest system impact often comes from communication: high-rate sensor streams (cameras, LiDAR, IMU), control loops (e.g., /cmd_vel, actuator setpoints), dense messages (point clouds, maps), and logging/rosbag I/O moving between processes, containers, and machines. So I framed this primarily as a communication problem and measured three things:
Latency — The time it takes for data or a command to travel from publisher to subscriber (or command to actuator). I report medians and tail percentiles (p95/p99) because tails matter in real-time systems.
Throughput — How much data successfully moves per unit time. Measured as messages per second (Hz) or bytes per second (MiB/s). This reveals saturation and back-pressure.
Jitter — The variability of timing (either inter-arrival period or latency). Think of it as the stability of your loop or stream: lower jitter means more predictable control. I quantify it via standard deviation and high-percentile deltas from the target period.
The test setup
Since latency, throughput, and jitter are our main ways to quantify speed differences between containerized and native setups, the suite centers on three core tests.
Pub/Sub Latency Benchmark
We publish timestamped std_msgs/msg/Header messages at 1 kHz from a publisher to a subscriber on the same host (and, in variants, across containers). The subscriber computes t_receive − t_send, capturing one-way ROS 2 latency across serialization, middleware transit, and scheduling. Running on one host avoids clock-sync errors; for cross-host variants, clocks are synchronized.
Large-Message Throughput Benchmark
We simulate high-bandwidth sensors (e.g., sensor_msgs/msg/Image or sensor_msgs/msg/PointCloud2) and measure how consistently the subscriber can keep up. We report sustained message rate (Hz) and data rate (MiB/s), which stress inter-process communication, memory management, transport buffers, and /dev/shm constraints under realistic load.
ROS 2 Control Jitter Benchmark
Using ros2_control_demos, we run a full 6-DOF arm control stack with a trajectory publisher at 1 kHz. We analyze the inter-arrival interval on /joint_states to quantify jitter—the variability of loop timing. Lower jitter means steadier control, tighter trajectories, and more predictable real-time behavior.
Beyond those, two more angles matter in robotics and often fuel the myths: hardware access and multi-container topologies.
micro-ROS Hardware-Access Benchmark
A publisher on an ESP32-S3 sends timestamped messages at 1 kHz over USB (CDC/ACM). We measure effective frequency and one-way timing to quantify any overhead from passing the device into a container via --device /dev/ttyACM* (vs native). This directly tests the claim that “hardware is tricky in Docker.”
Multi-Container Benchmarks
For both the Latency and Large-Message Throughput tests, we split publisher and subscriber into separate containers to isolate overhead from the Docker networking stack. We run on the default bridge and with host networking to compare the impact of NAT/virtual switches vs direct host-stack access.
Hardware & Load Profile
All tests run on a Jetson Orin Nano Super as I wanted to observe the effects on a resource-constrained embedded device, something similar to what might actually be used for robotics. Each benchmark is executed at idle and under ~95% CPU load using stress-ng to expose tail latencies and worst-case behavior.
Results
Latency
These plots come from the 1 kHz pub/sub latency benchmark, comparing native vs. Docker on the same host at two load levels (idle and ~95% CPU). This benchmark captures serialization, middleware transit, and scheduling. The three figures show the distribution boxplots with outliers, short time-series traces, and lag plots to reveal temporal structure.
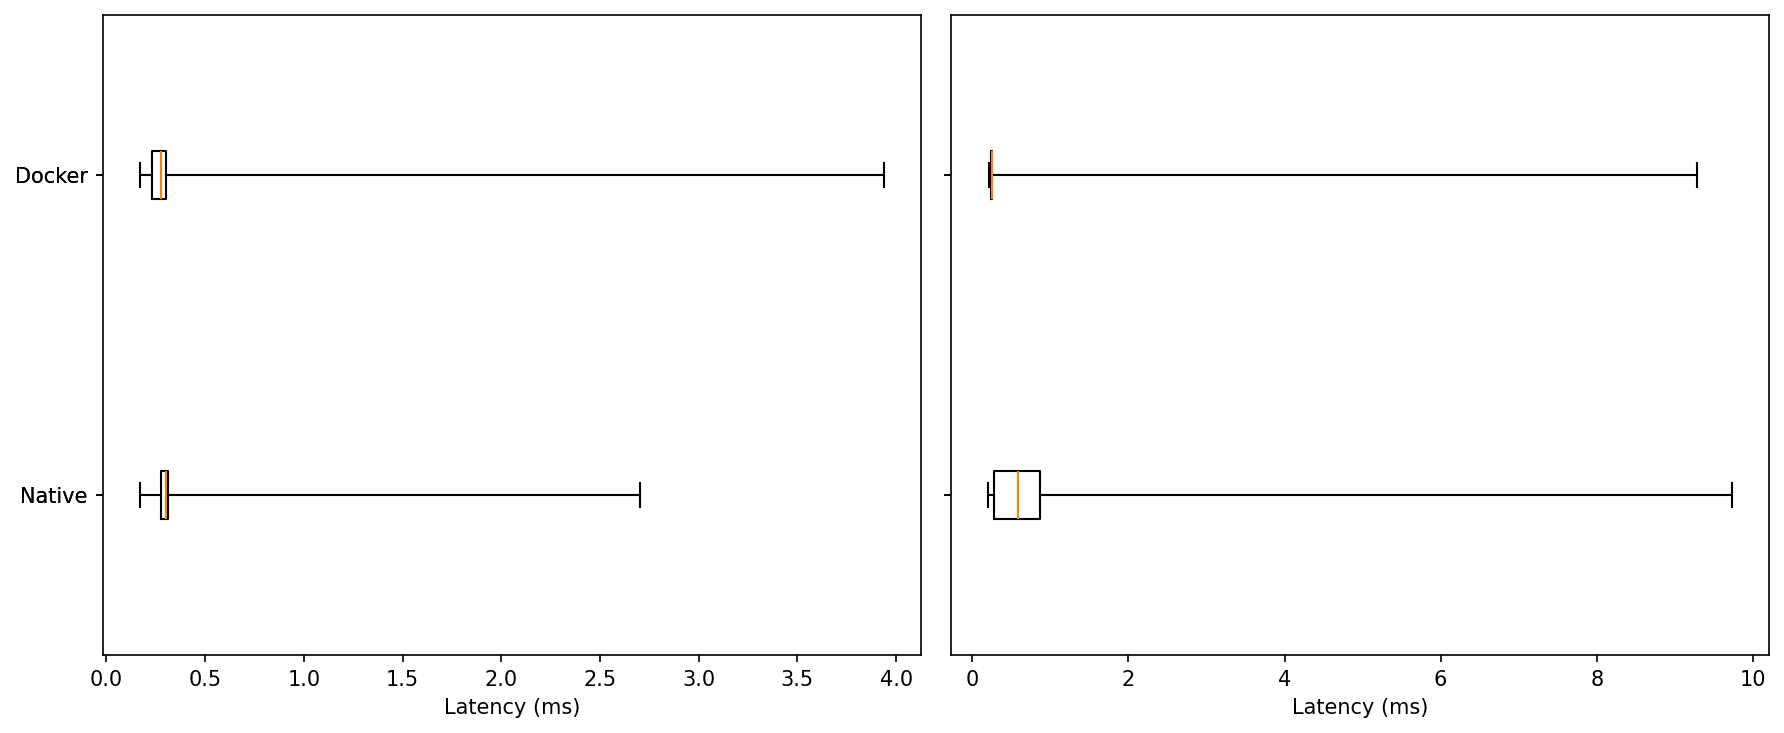
Idle: Medians are nearly identical for native and Docker, both in the few-hundred-microsecond range. In this run Docker shows a slightly longer single outlier (~4 ms vs ~2.7 ms native).
Under Load: The distributions widen for both, but Docker’s upper tail is shorter; native produces the largest excursion (~9–10 ms).
Typical performance is the same. Under load, Docker contains worst-case latency a bit better.
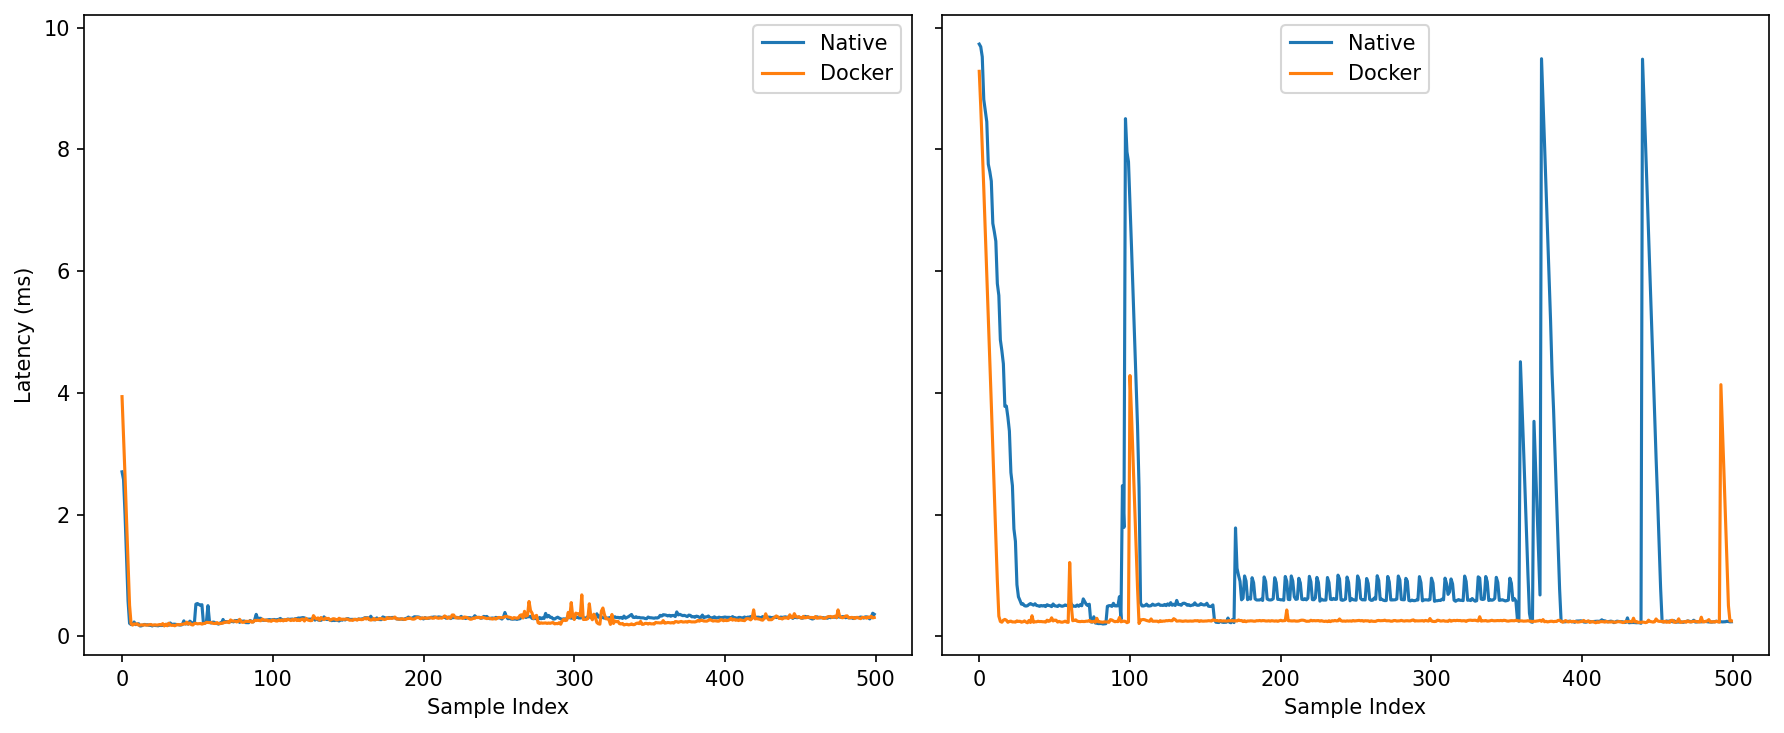
Under Load: The contrast sharpens. Native exhibits visible oscillations and several multi-millisecond spikes; Docker holds a calmer baseline with fewer and smaller bursts (one notable blip ~4 ms, but nothing like native’s repeated excursions).
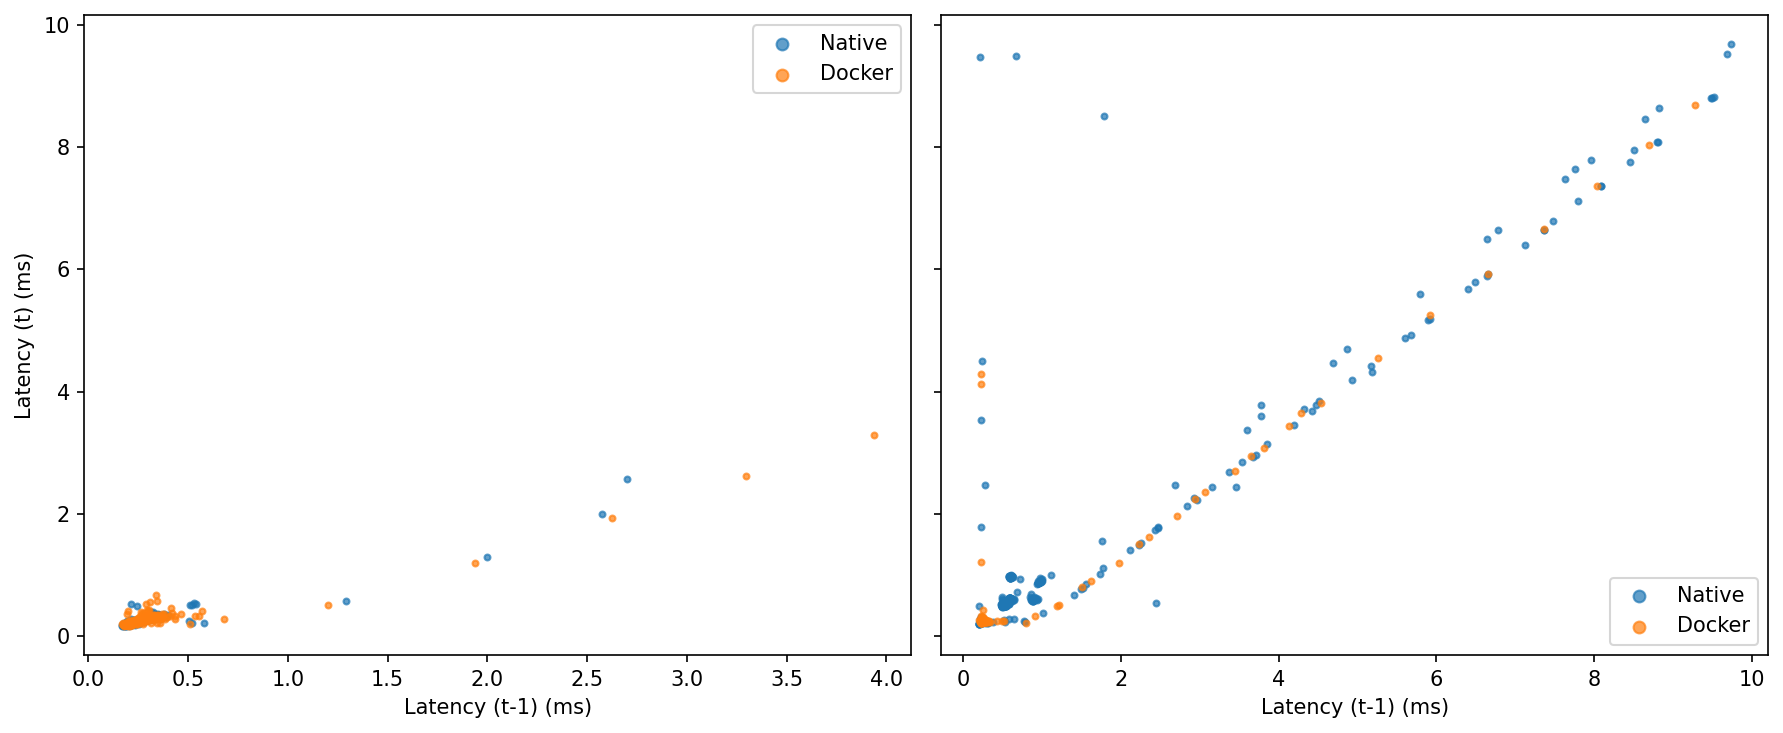
Idle: Tight clusters near the origin for both—little lag-1 autocorrelation.
Under Load: Points align along the 45° line, showing burstiness. Native populates that diagonal out to the extremes; Docker shows fewer extended streaks away from the origin.
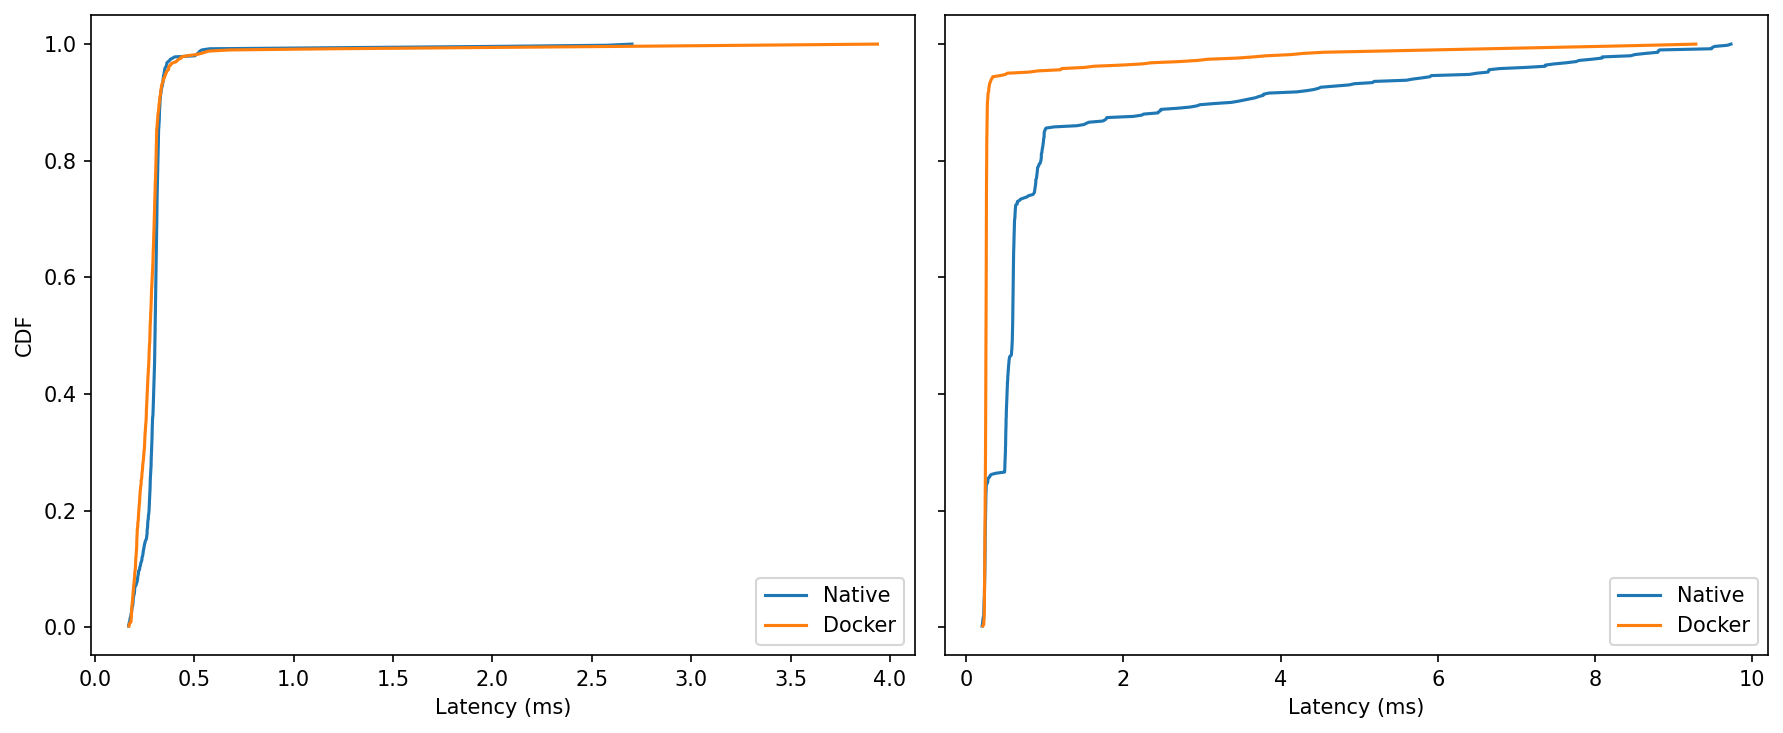
Idle: Curves almost overlap; if anything, Docker is a hair left around the 0.3–0.5 ms knee—too small to matter in practice.
Under Load: The Docker curve reaches 99–100% sooner, while native creeps out toward ~9–10 ms.
At idle, native and Docker are effectively indistinguishable, with a slight tail edge to native in this particular run. Once the system is under pressure, the balance tilts: Docker keeps the distribution tighter, trims the far-right tail, and exhibits fewer prolonged bursts, while maintaining the same median latency. For control loops and perception pipelines that care about predictability more than bragging-rights medians, that reduction in worst-case behavior is the meaningful win.
Throughput
This benchmark measures how many large ROS 2 Image messages a system can reliably handle over a short 10-second window, focusing on receive-side throughput rather than end-to-end latency. It publishes fixed-size 640×480 RGB8 frames (~0.88 MiB each) at a target rate of 200 Hz, creating a sustained high-bandwidth load of up to ~176 MiB/s.
The monitor node records high-resolution receive timestamps to calculate effective message rate (Hz), payload throughput (MiB/s), and test duration.
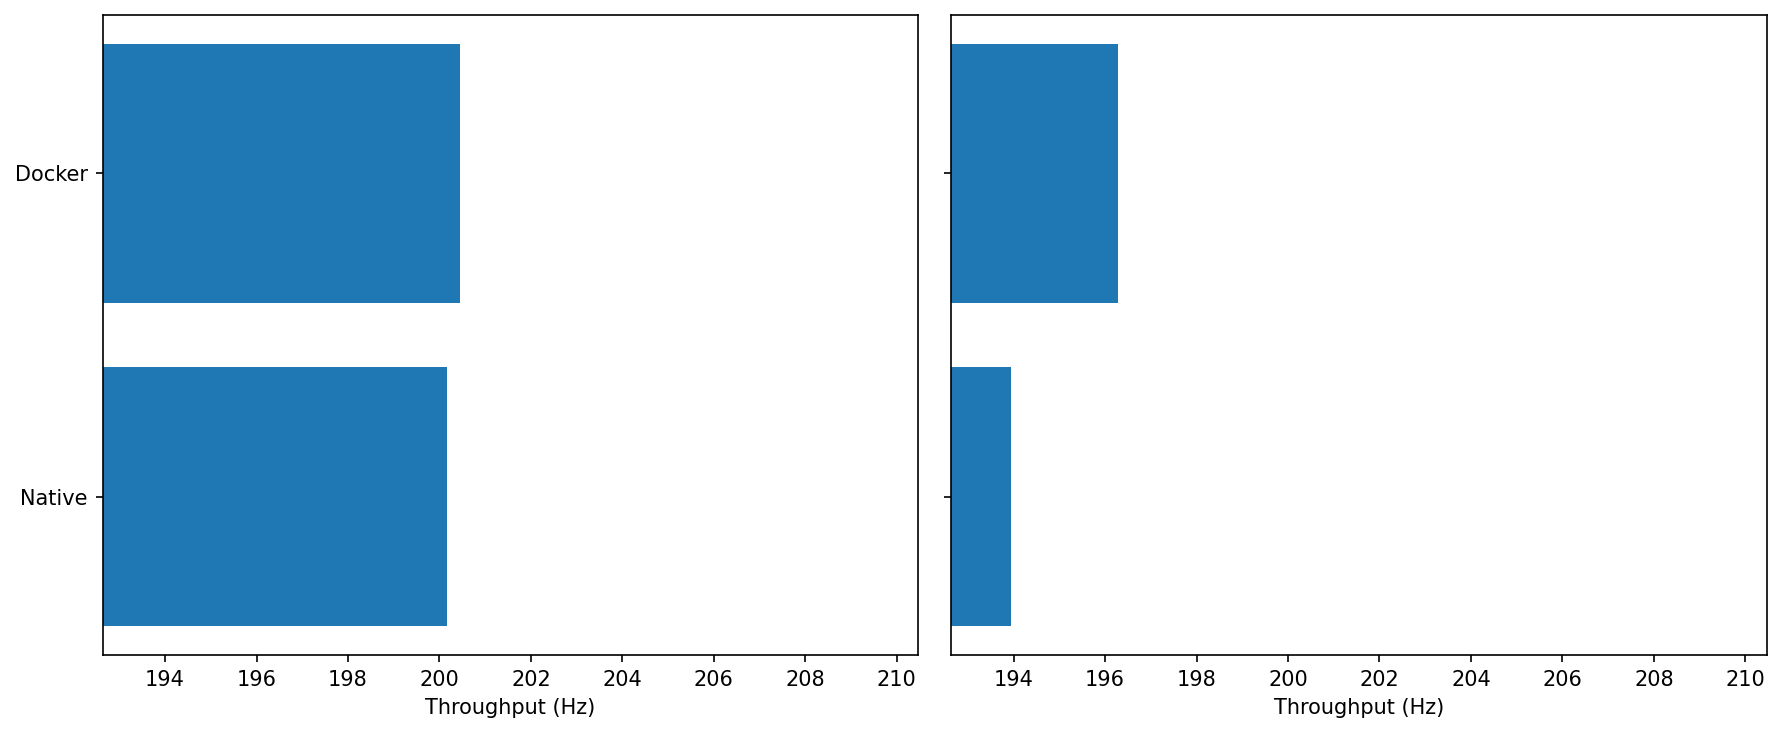
0% CPU: Both sit at ~200–201 Hz; Docker is fractionally higher.
Under Load: Docker ≈196–197 Hz vs Native ≈193–194 Hz.
cgroup fairness seems to favor Docker under contention, it gives the container’s threads a steadier timeslice than miscellaneous native processes fighting in the same slice
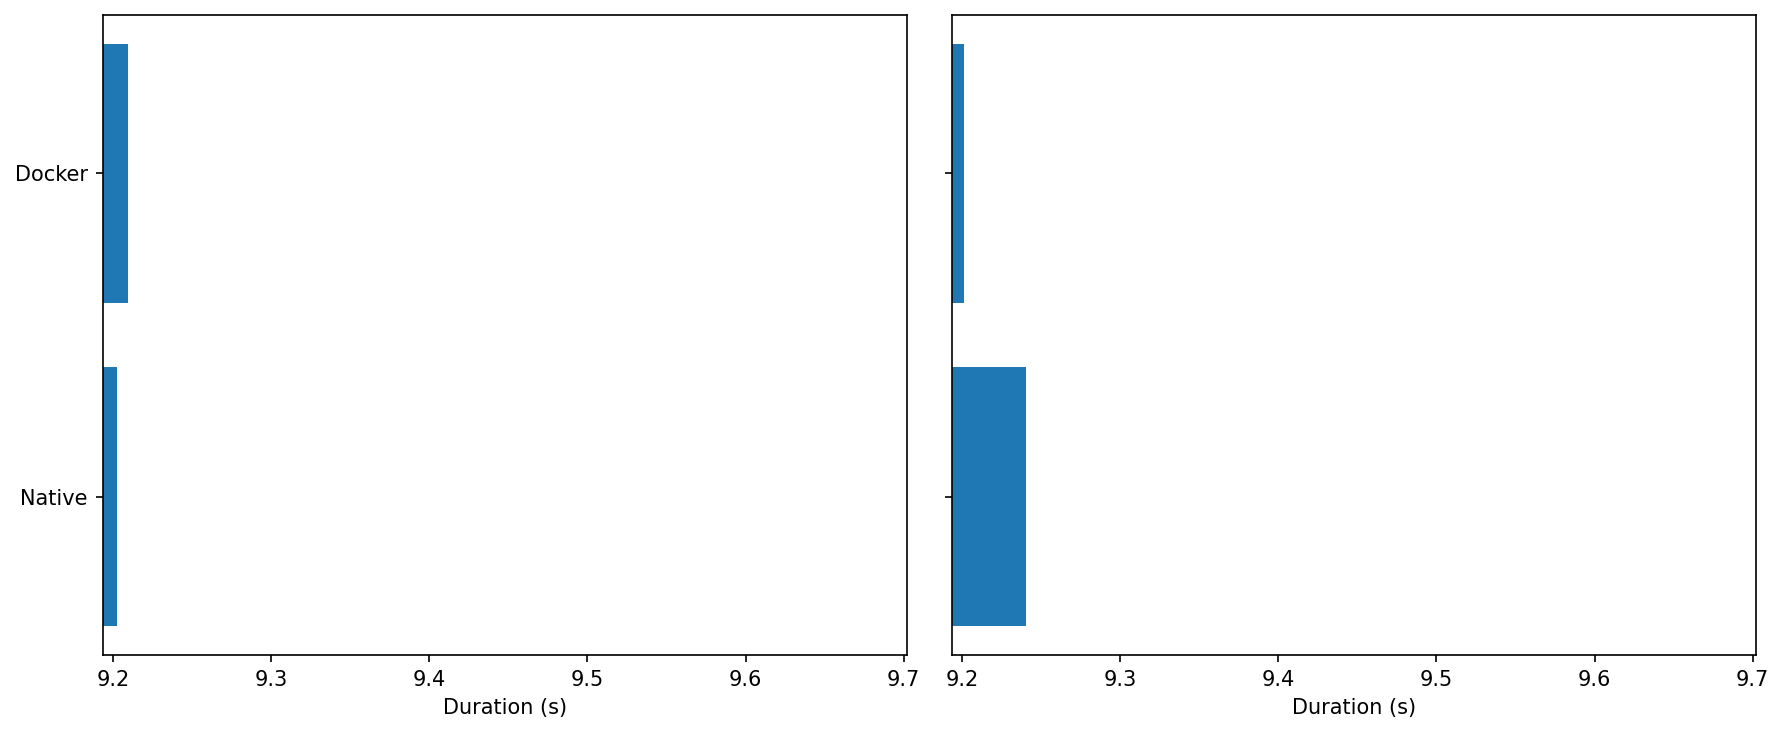
0% CPU: Both runs complete in ~9.2 s—indistinguishable.
Under Load: Docker’s bar is slightly shorter, consistent with the higher sustained Hz above.
Over a fixed payload, Docker finishes marginally sooner when the CPU is hot.
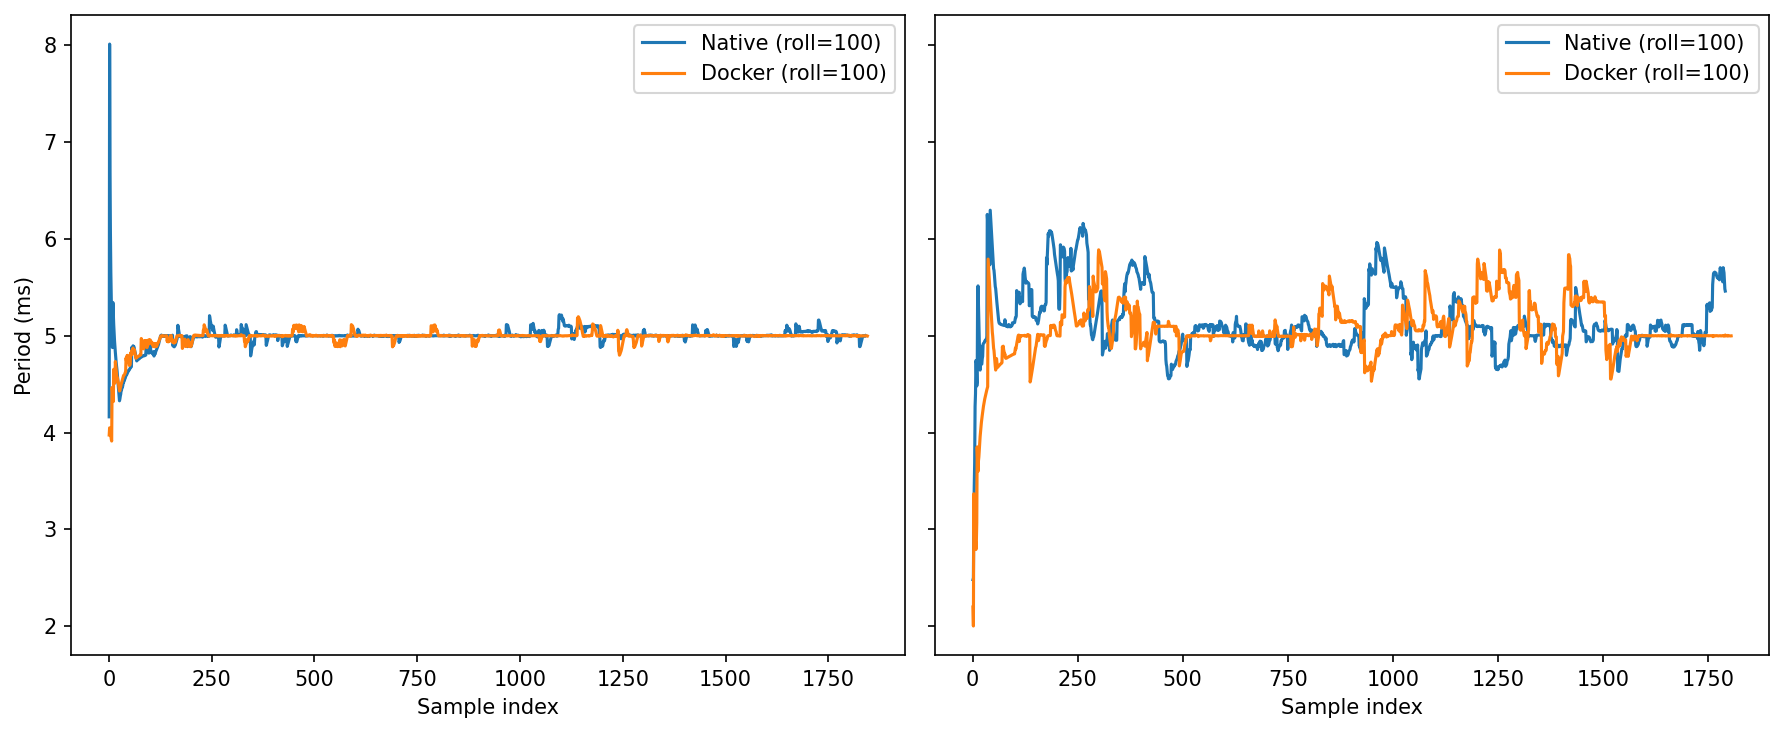
0% CPU: After warm-up, both converge tightly around ~5.0 ms (the 200 Hz target) with tiny undulations.
Under Load: Oscillations grow for both. Docker tends to return to 5.0 ms a touch faster after excursions; native shows a bit more amplitude in the mid-run ripples.
Same average, slightly steadier settling for Docker under load.
0% CPU: Compact clusters near (5 ms, 5 ms) for both—weak lag-1 autocorrelation.
Under Load: Scatter widens, showing bursts (points drift away from 5 ms). The two clouds largely overlap; Docker’s points are a bit more concentrated near the center.
Bottom Line:
Bandwidth: MiB/s is flat—Docker neither helps nor hurts headline throughput on a single host.
Rate stability: In Hz and period-based views, Docker shows a small but repeatable edge under load (closer to 200 Hz, slightly tighter period clustering, quicker recovery after excursions).
These gains are consistent with scheduler fairness and buffering effects, not with Docker being inherently “faster.” The important takeaway for robotics is that containerization doesn’t cap large-message streaming and can make it a bit steadier when CPU pressure rises.
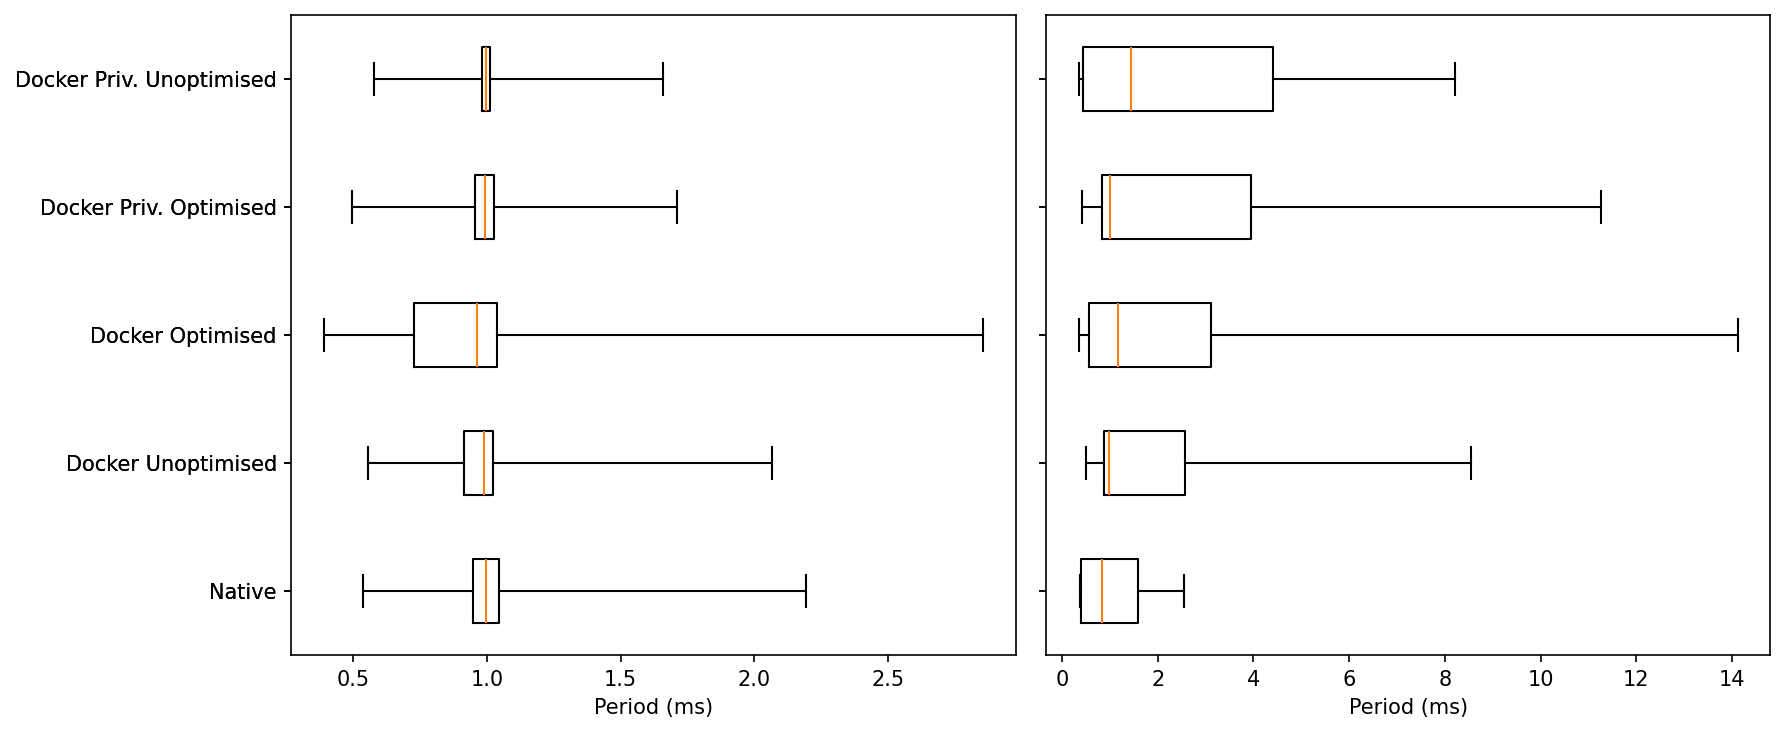
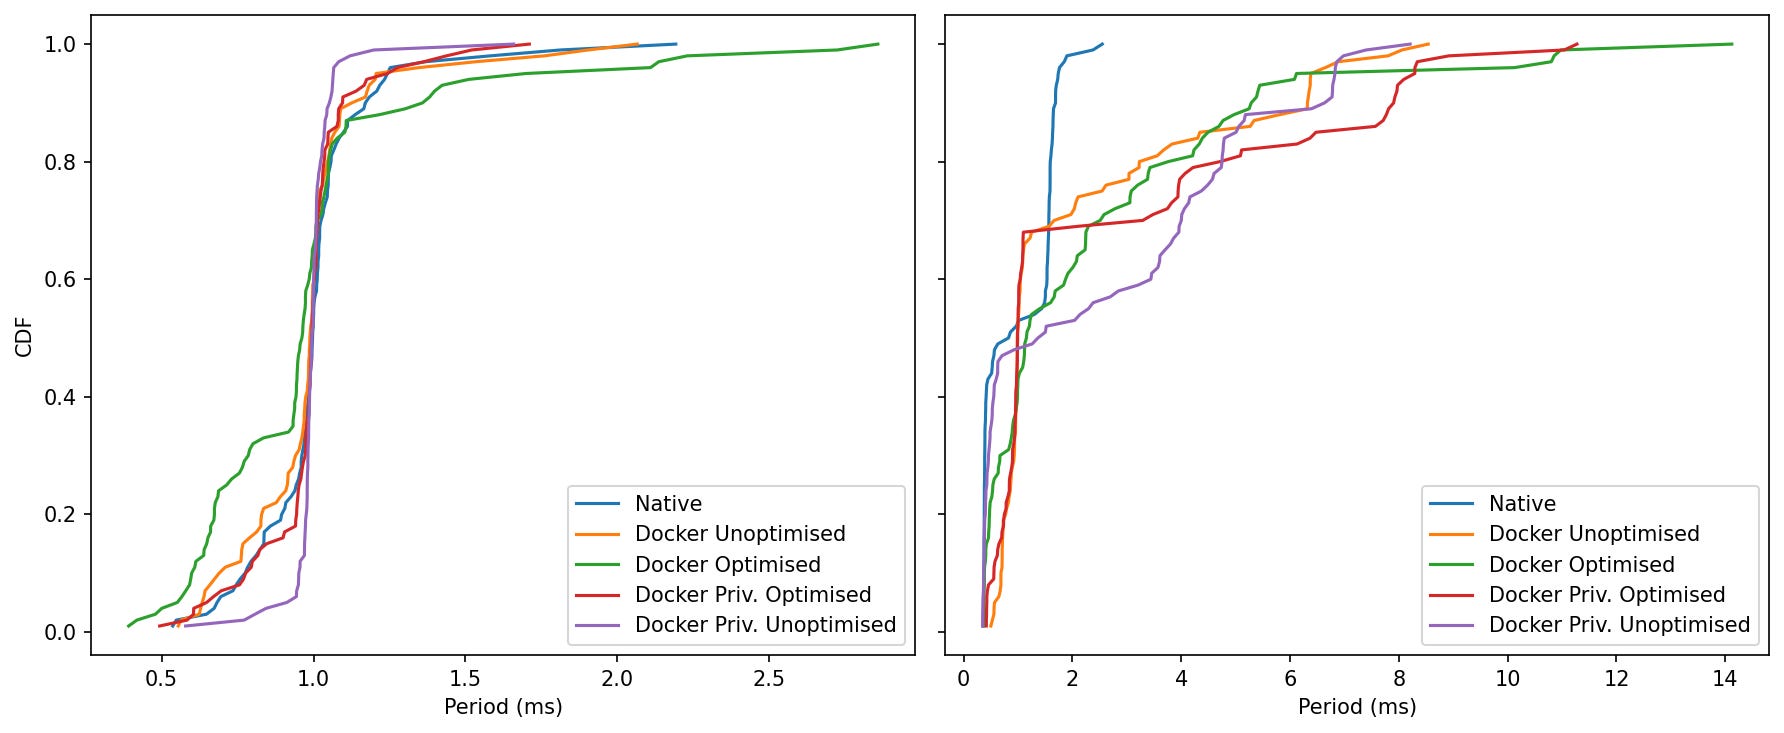
ROS Control Jitter
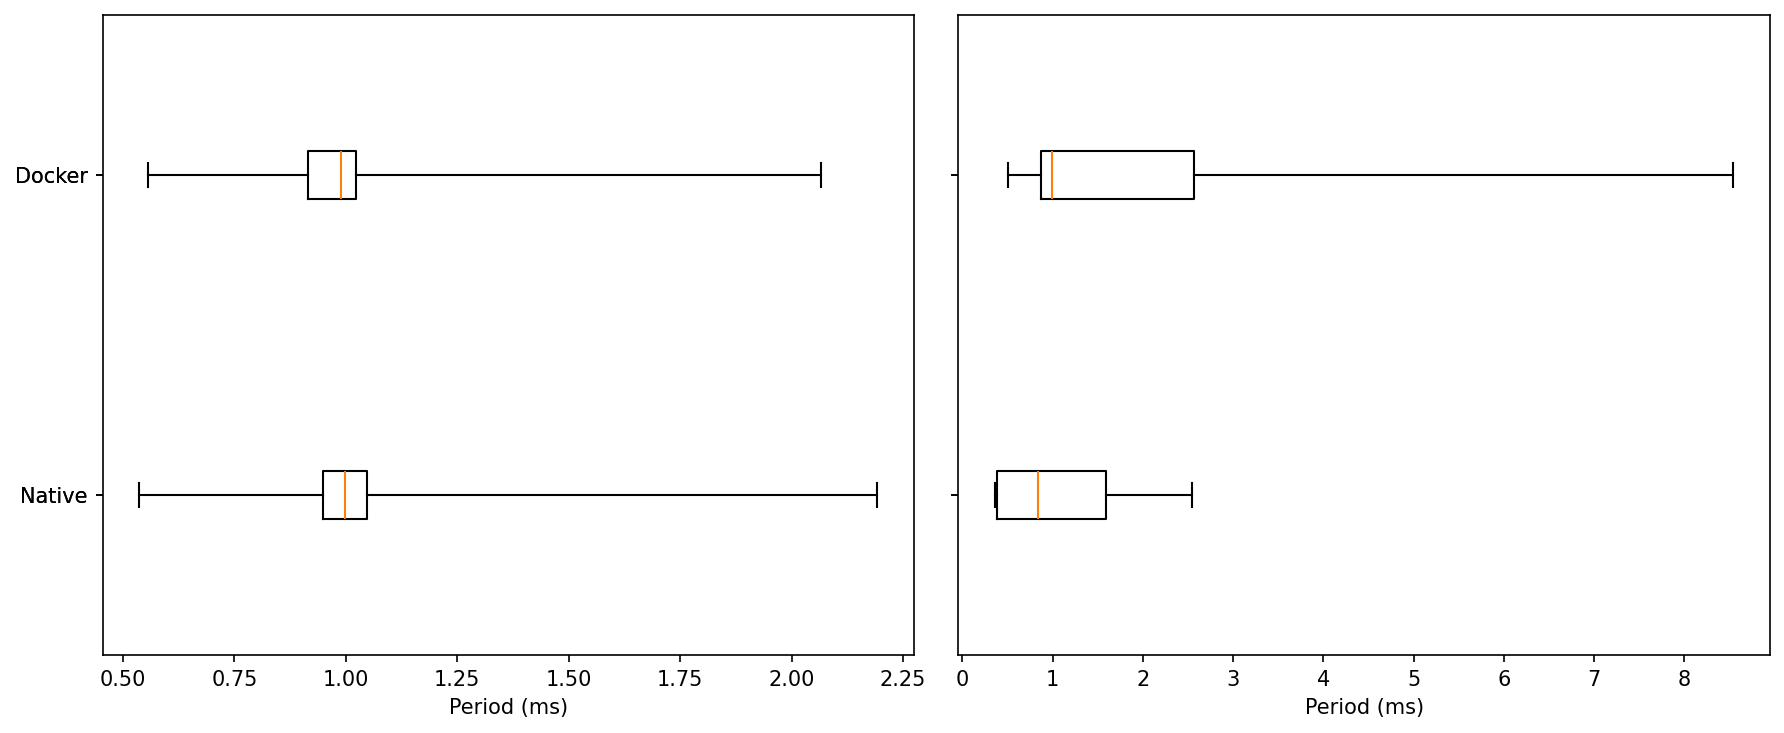
Idle: Both native and Docker sit at a median ≈ 1.0 ms with very similar IQRs. Minima are ~0.55 ms for both. Upper whiskers top out around ~2.1–2.3 ms.
Read: At idle, the two are essentially indistinguishable.Under Load: Medians stay near ~1.0 ms, but tails diverge. Native’s upper whisker ends around ~2.6 ms, while Docker shows rare excursions up to ~8.5–8.8 ms.
Read: Under load, most samples are still close to 1 ms for both, but Docker carries a heavier extreme tail.
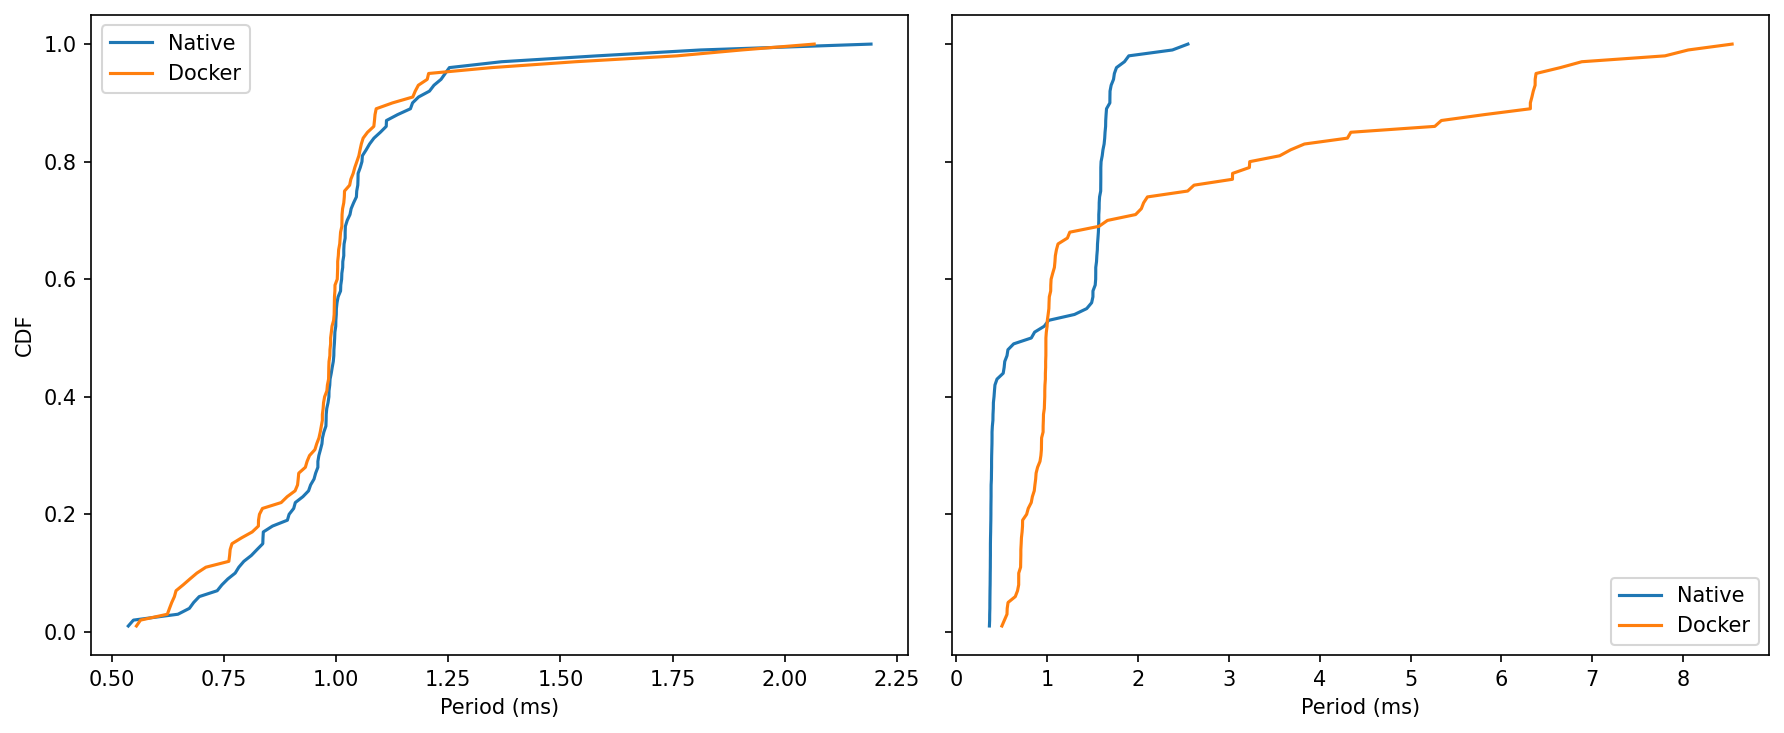
Idle: Curves nearly overlap from ~0.6 to ~1.2 ms; both reach ~99% by ~1.2–1.3 ms.
Read: No meaningful separation at idle.Under Load: Native climbs to its asymptote by ~2–3 ms. Docker’s curve keeps creeping right, reflecting those rare >5 ms samples and a few near ~9 ms.
Read: The bulk of Docker’s samples remain in the same band as native, but the upper tail is longer.
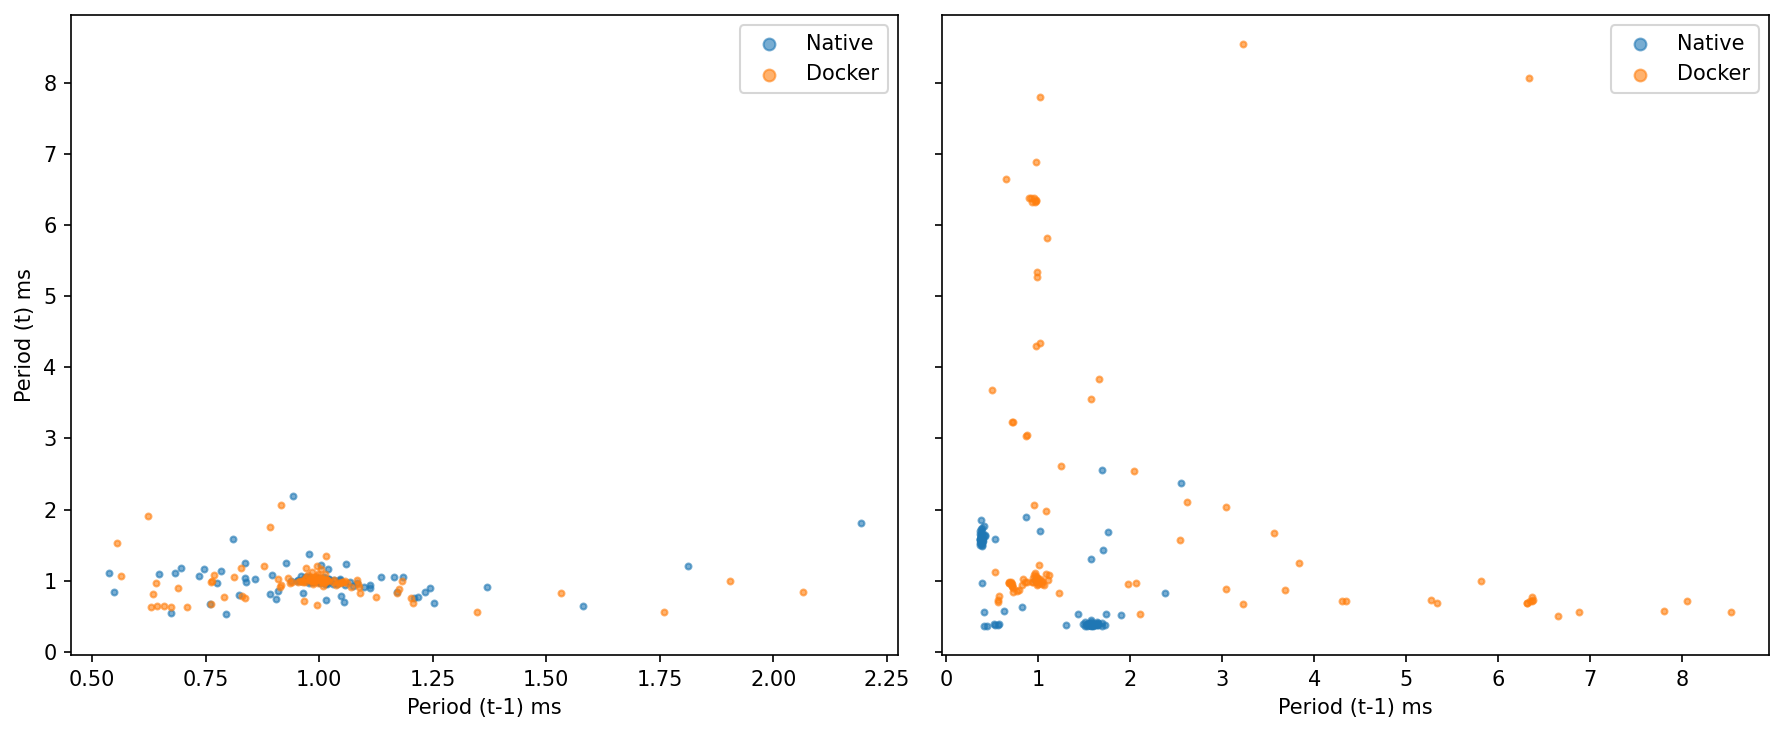
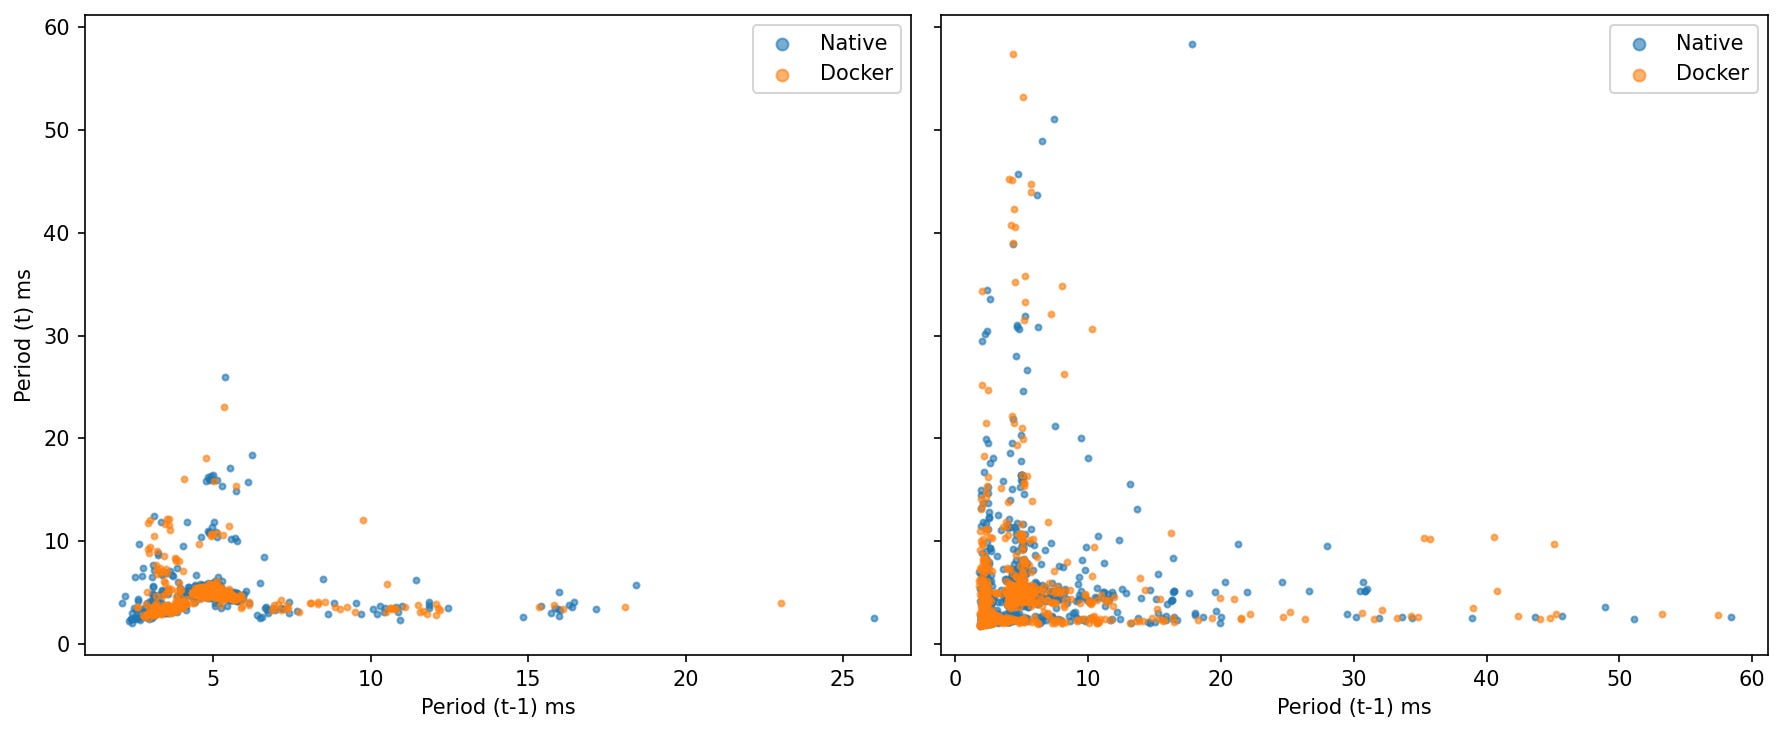
Idle: Tight cluster around (1.0, 1.0) ms for both—little lag-1 autocorrelation; one slow tick doesn’t predict the next.
Under Load native spreads to ~2–3 ms but stays compact; Docker shows several points where period(t−1) is very large (3–8+ ms) and period(t) snaps back near ~0.8–1.2 ms.
MicroROS Throughput
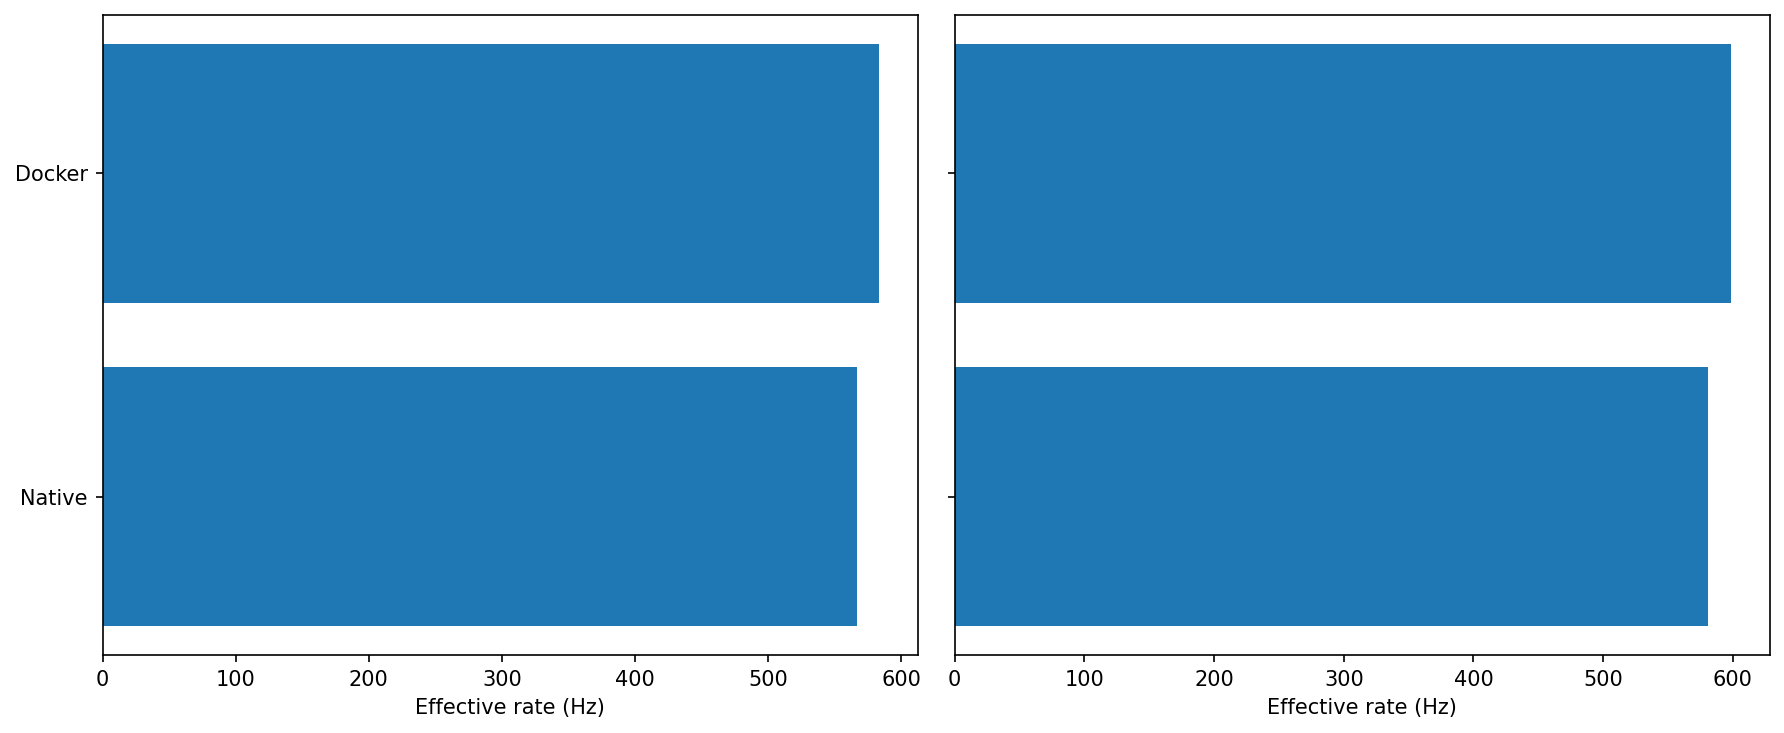
Idle: Docker lands a hair higher than Native (both ~570–590 Hz, Docker ahead by a few percent).
Under load: Same story—both hold ~580–600 Hz, with Docker again slightly ahead.
For sustained throughput, Docker shows no penalty and is often a touch faster. This test is clearly bounded by the link/agent path rather than container overhead.
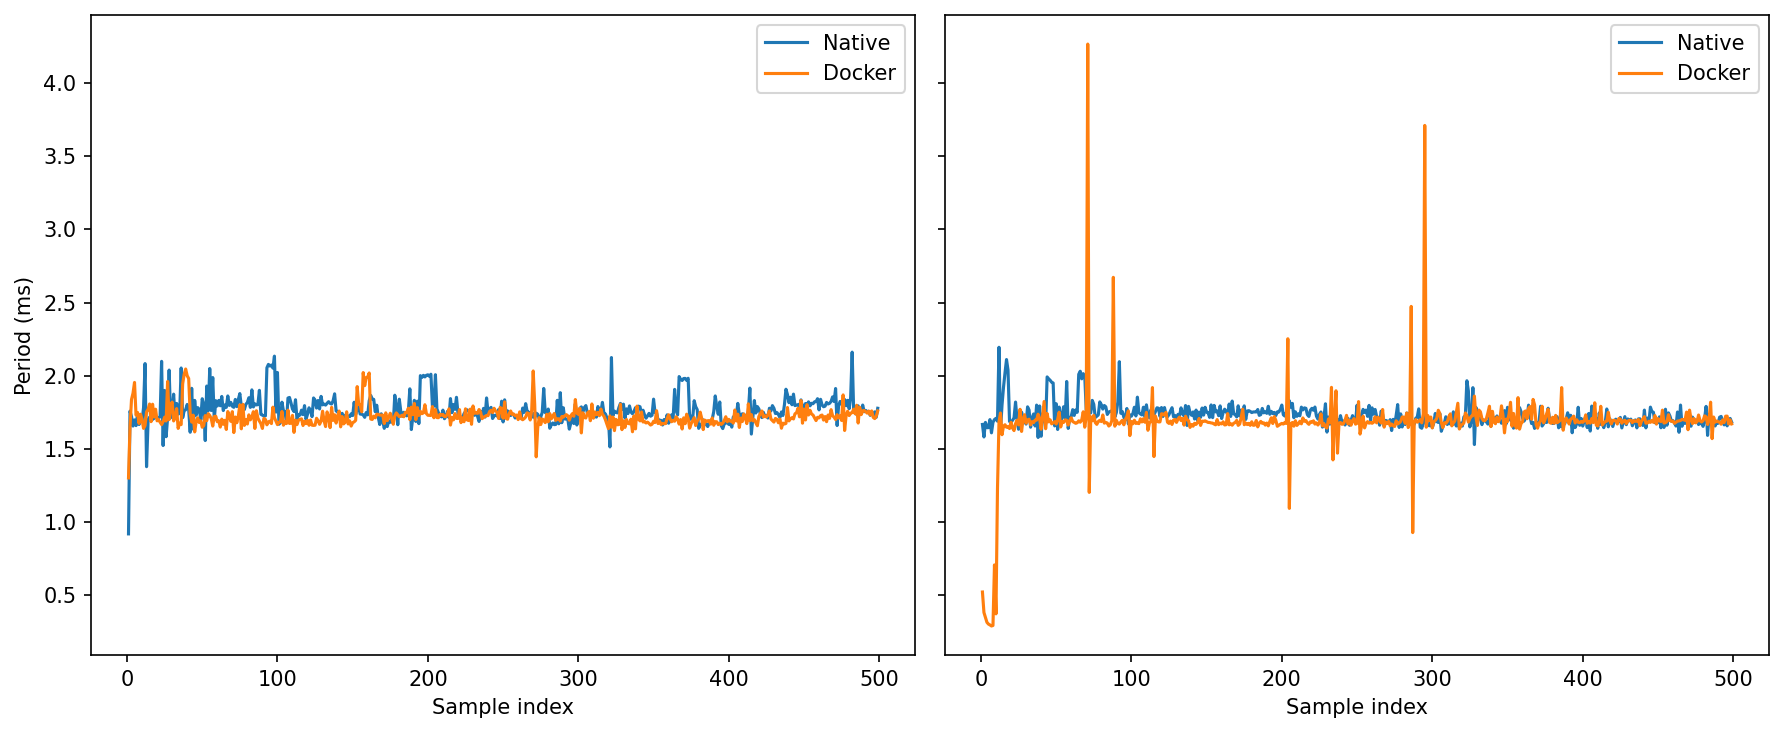
Idle: Both sit tightly around ~1.7–1.8 ms with small ripples.
Under load: Native keeps spikes mostly below ~2.2 ms. Docker shows a few tall single-cycle excursions (up to ~4 ms+).
Average rate is fine in both, but Docker’s worst-case jitter tail is longer under load. If you care about throughput, Docker is perfectly viable (and sometimes a whisker better).
Well actually,
Docker is tuned for isolation and web-style workloads: short-lived services, multi-tenant hosts, least privilege by default. That means separate IPC namespaces, a tiny shared memory, conservative capabilities, and cgroup boundaries that make sense for stateless APIs—but not necessarily for high-rate sensor pipelines or real-time control.
In robotics we usually own the machines. We’re not hosting strangers; we’re chasing predictability, low latency, and easy hardware access. The big wins from containers for us are software-architecture wins—reproducible builds, modularity, clean dependency graphs, simple OTA updates, clean rollback—not strong tenant isolation.
Let's try trading some of the isolation for more performance and optimise Docker for robotics, especially ROS2.
Here are some things that we could do:
Shared Memory
In Fast DDS used by default by ROS2, SHM is a transport that kicks in when publisher and subscriber live on the same machine. Instead of pushing bytes through the kernel’s networking stack (UDP/TCP), each node allocates a shared-memory segment and writes messages into segment buffers there. Rather than copying the whole message to every recipient, Fast DDS only passes a tiny buffer descriptor. Readers then map the producer’s buffer directly and read the data in place. This means fewer copies, fewer syscalls, and support for very large messages without protocol fragmentation—typically faster than UDP/TCP even over loopback.
Each container gets it's own /dev/shm, but the default size, 64MB might not be enough for large message buffers, such as Images, Point Clouds, etc.
Docker allows you to increase the shared memory of a container using --shm-size=, but this increases RAM usage, so use it mindfully depending on your system.
Host IPC
Puts the container in the host’s IPC namespace. Processes inside can see/use the host’s POSIX/System V IPC objects (including /dev/shm).
With default isolated IPC namespaces, two different containers can’t share SHM. --ipc=host lets nodes in separate containers (or host↔container) use the same SHM segments, enabling near–zero-copy paths and trimming latency/jitter.
However this weakens isolation—your container can read/write the host’s IPC objects (and vice-versa). If all cooperating nodes run in the same container, you usually don’t need this; just increase shm size, if you split ROS functionality into multiple containers, this is crucial.
Host cgroup namespace
Control groups (cgroups) are a Linux kernel feature that lets you group processes and then limit, account, and isolate the resources they use—CPU time, memory, I/O bandwidth, number of processes, etc. They’re hierarchical (groups inside groups) and each resource has a “controller.” In modern distros you’ll almost always be on cgroups v2 (a unified hierarchy at /sys/fs/cgroup), managed by systemd. Docker/Podman place each container in its own cgroup so the kernel can enforce limits and report usage.
Using --cgroupns=host shares the host’s cgroup namespace with the container. Inside the container you see the host’s cgroup tree/paths. This makes it easier to coordinate scheduling policy from the host—e.g., pin the container’s processes into a specific cpuset, align with IRQ-isolated cores, or let host monitors see accurate cgroup stats. Functionally it can reduce “mystery” jitter by making CPU affinity/quotas more explicit and easier to manage across tools.
Additionally this allows you to pin cores to specific cores, for example you might want to dedicate some of the cores to the control container to ensure better predictability.
--cgroupns=host is a coordination flag. It lets containers and the host share the same view of scheduling and limits, which makes it far easier to build a predictable, low-jitter ROS stack on machines you control.
Privileged Mode
Grants all Linux capabilities, disables most device restrictions, and exposes essentially all host devices. It also relaxes several seccomp/AppArmor/SELinux constraints. In short: the container becomes almost like running directly on the host. It’s a blunt fix when something can’t access a device/bus (USB, GPIO, CAN, I2C) due to missing capabilities or cgroup device rules.
A lot of robotics guides say “just run it privileged.” I decided to include it to check how it influences scheduling and performance.
Let's take a look at our previous benchmarks with these optimisations turned on.
Results Revisited
Latency
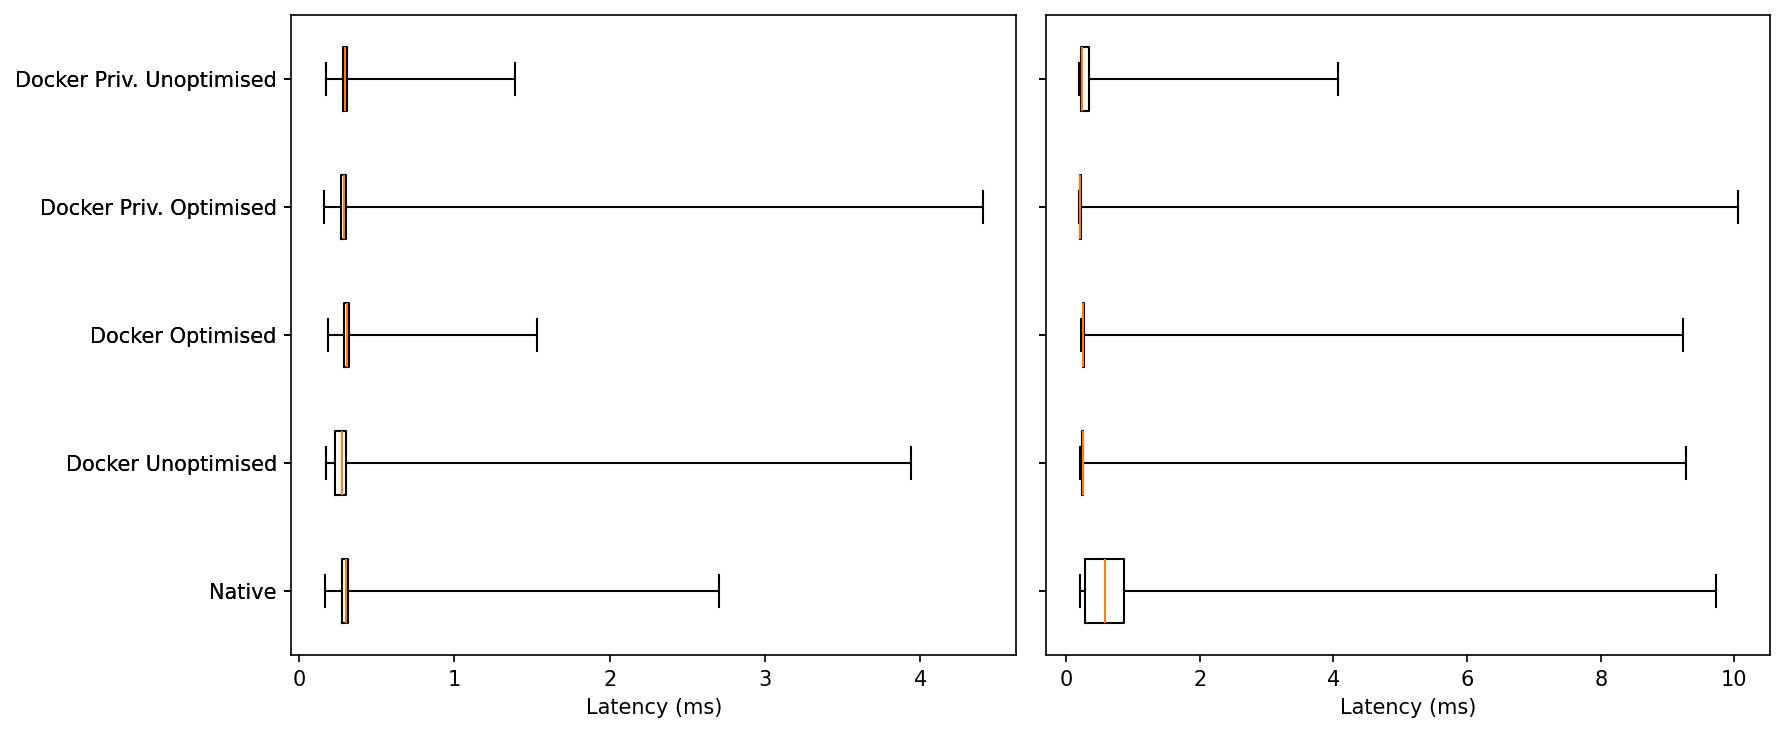
Idle: Medians are essentially identical (few-hundred µs) across all five. The tails differ: Docker Optimised has one of the shortest upper whiskers, while Docker Unoptimised and Docker Priv. Optimised show the longest single outliers (up to ~4 ms).
Under Load: Everyone widens, but Native exhibits the largest extremes (~9–10 ms). The container variants remain tightly centered; in this run Docker Priv. Unoptimised shows the shortest max tail, with the other Docker modes clustered behind Native.
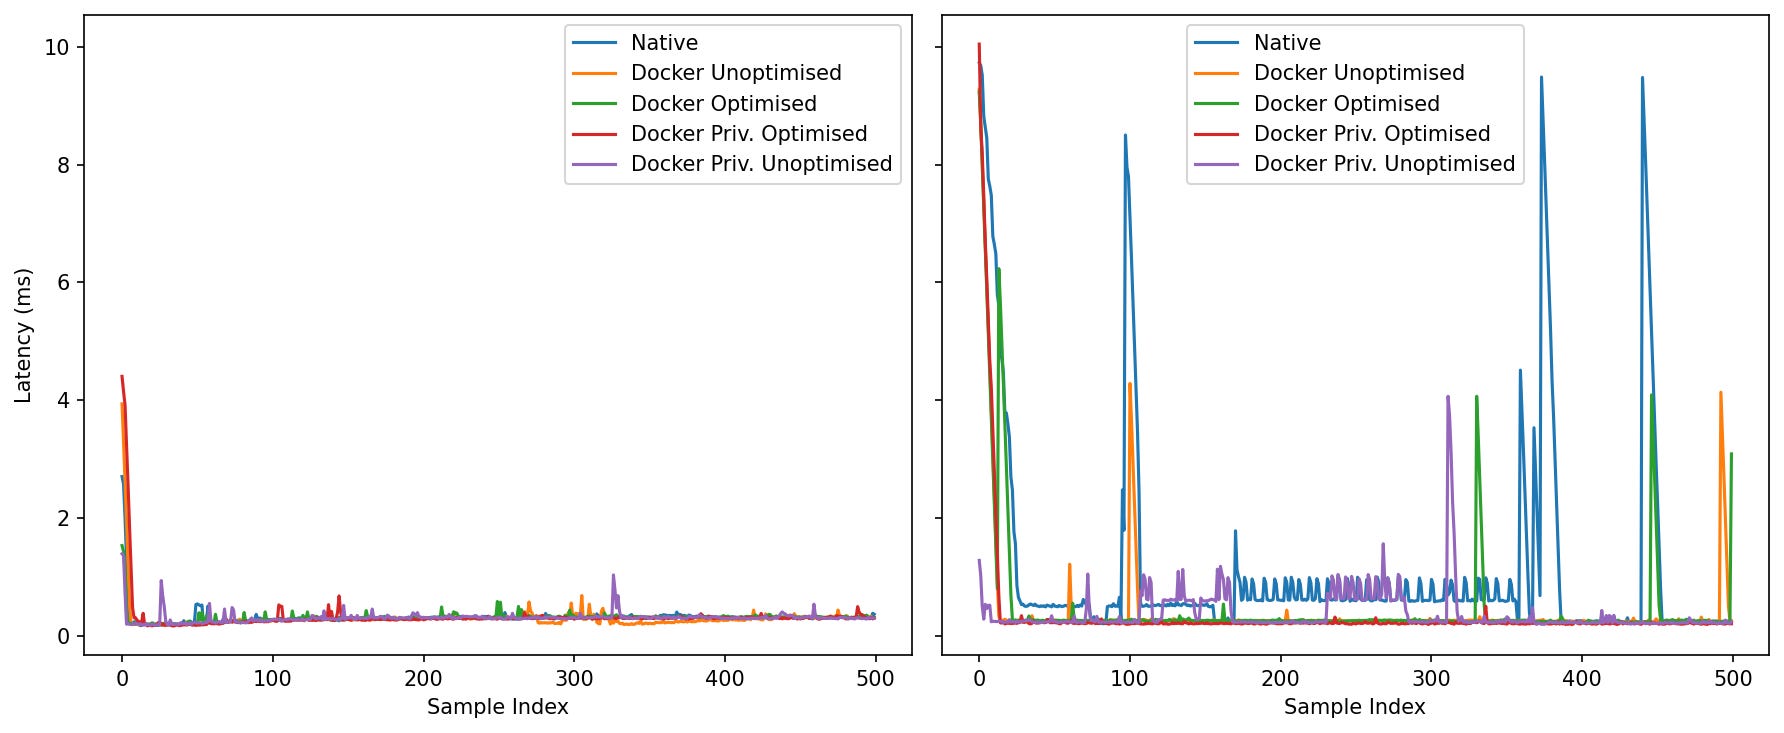
Idle: After the warm-up blip, all five settle around ~0.2–0.4 ms. Spikes are rare and configuration-specific, but short-lived.
Under Load: The contrast sharpens. Native develops a long oscillatory plateau (~0.5–1.0 ms) and several multi-ms spikes (two near 9–10 ms). The Docker lines hold a calmer baseline with fewer bursts; Docker Priv. Optimised is the quietest in this run, while Docker Unoptimised and Docker Optimised show occasional single spikes that quickly recover.
Under contention the containerised agents are visibly steadier; long bursty phases are most pronounced in the native trace.
Idle: Tight blobs near the origin for all modes—little lag-1 autocorrelation; slow samples don’t reliably trigger another slow sample.
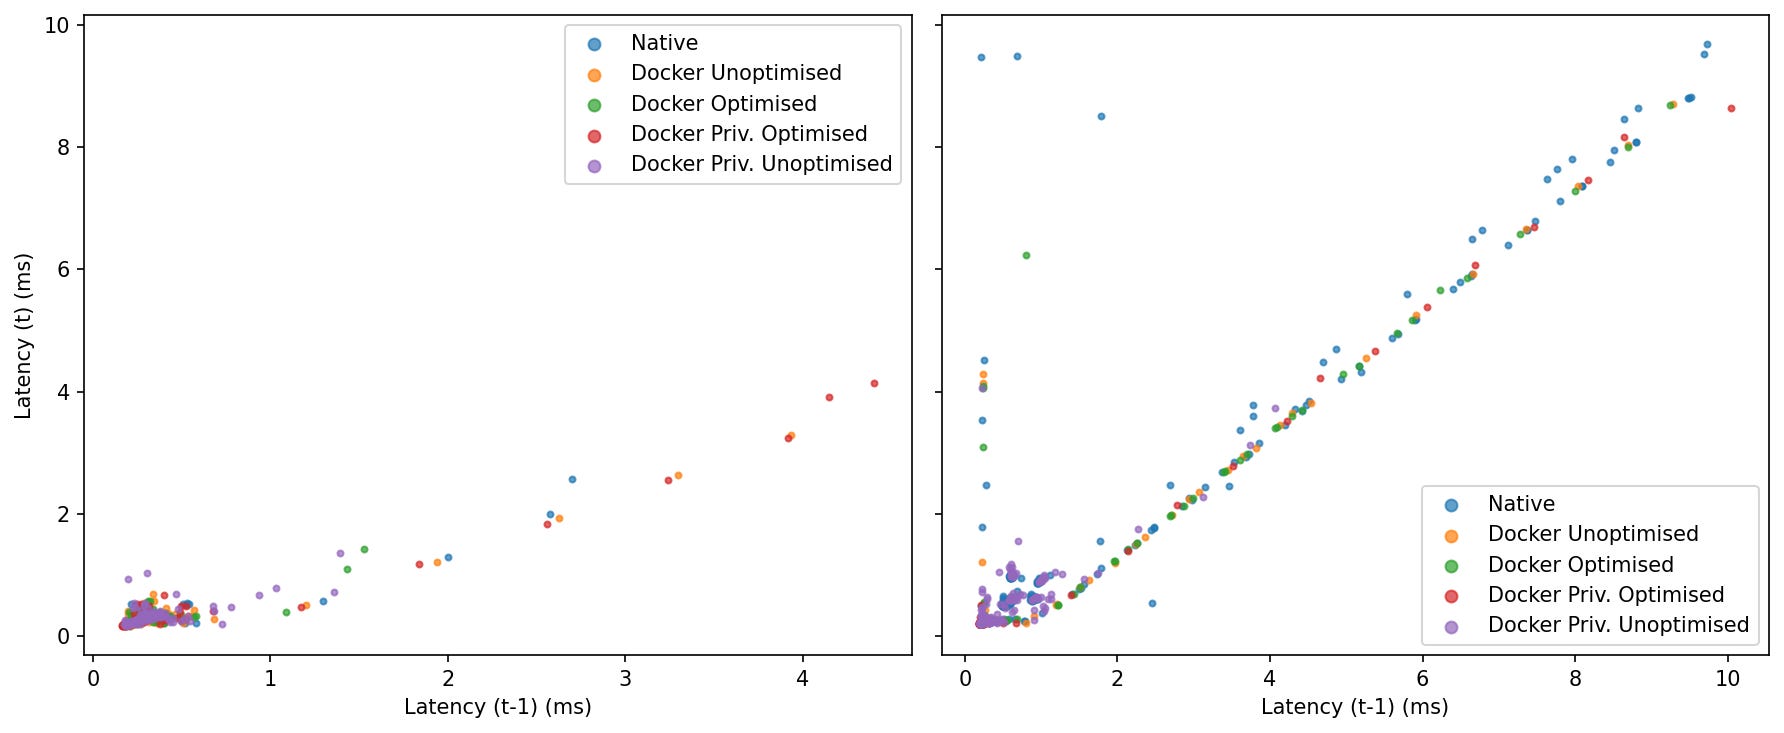
Under Load: Points align along the 45° line, revealing burstiness. Native populates the diagonal out to the largest values; the Docker modes cluster closer to the origin with fewer extended streaks, with Priv. Optimised and Priv. Unoptimised showing the most compact clusters in this run.
Throughput
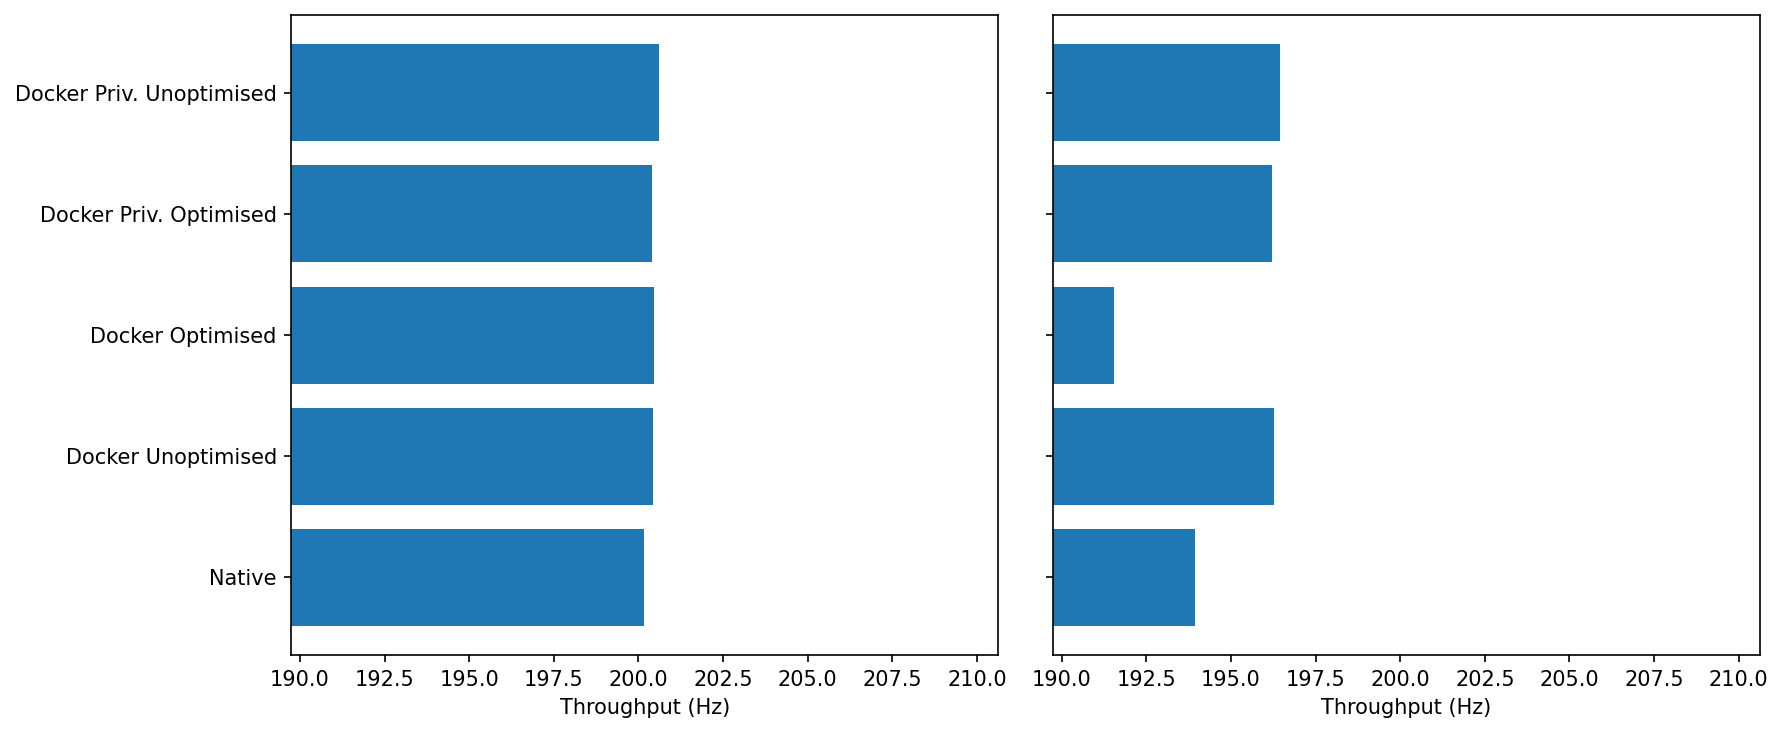
Idle: Everyone sits around the target ~200–201 Hz with <1 Hz spread.
Under Load we see a little separation:
Docker Unoptimised / Docker Priv. (Opt/Unopt): ~196–197 Hz
Native: ~193–194 Hz
Docker Optimised: ~191–192 Hz (lowest in this run)
Under load, most container modes keep the stream slightly closer to 200 Hz than native; the outlier is Docker Optimised, which regresses a few Hz.
The “optimised” bundle includes --cgroupns=host. If the container inherits a busy host cgroup with specific weights/affinity, it can experience short, regular stalls (lag plots corroborate bursts). That doesn’t hurt MiB/s, but it can dent per-message rate a bit. (Nothing to do with SHM; that path is already fast.)
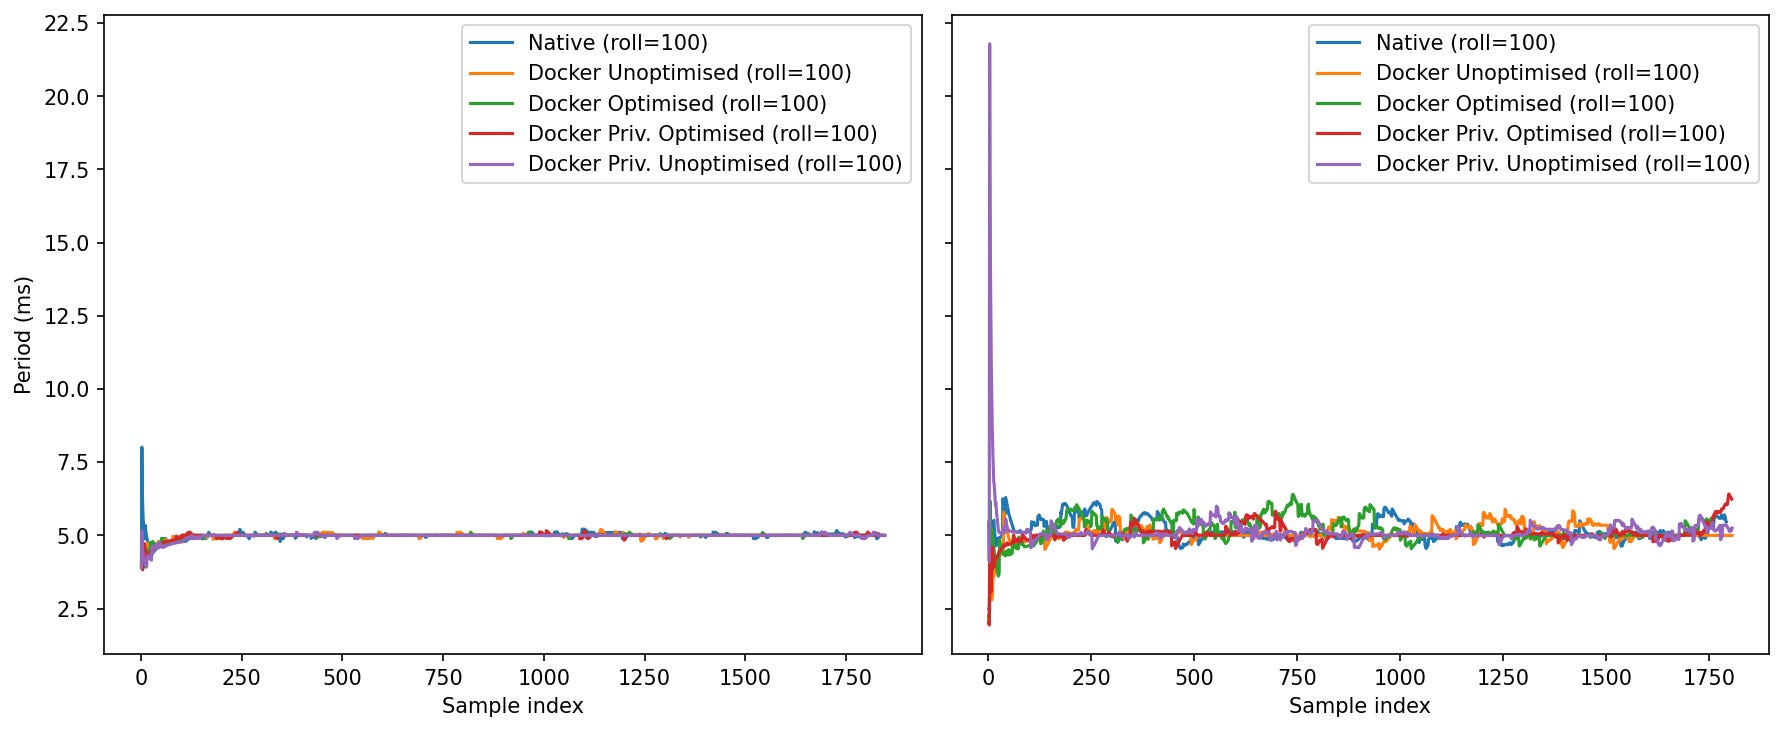
Idle: After warm-up, all lines sit tightly at ~5.0 ms (200 Hz) with tiny ripples. One notable quirk: Docker Priv. Unoptimised shows a single large start-up spike (>20 ms) before settling.
Load: Oscillations appear for everyone. The lines hover around 5.0–5.6 ms with occasional swells; none of the container modes persistently diverges, but Native and
Once warm, period stability is similar; privileged-unoptimised needs a moment to “seat,” and under load the “optimised” bundle isn’t always the smoothest.
Why the warm-up spike? First-touch allocation and SHM buffer mapping can fault a chunk of memory and trigger brief stalls. Privileged/unscoped devices can also fire a flurry of softirqs at start.
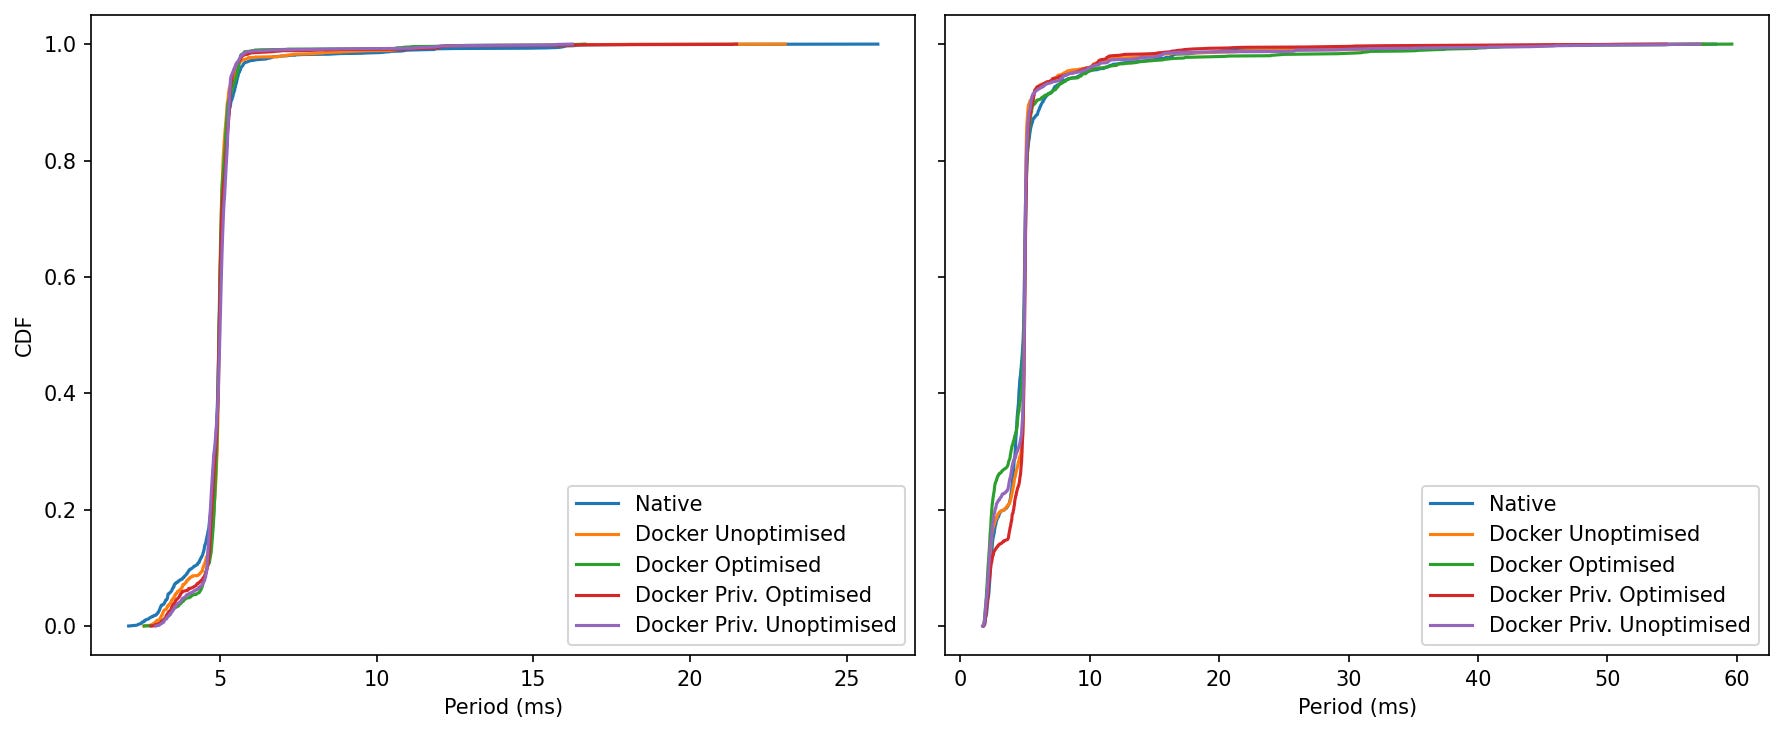
Idle: The curves overlap almost perfectly; ~95–99% of samples stack tightly around 5.0 ms.
Load: All curves remain close. The Docker families reach 0.95–0.99 slightly earlier than native (more samples at or below 5–6 ms). The worst-case far right depends on the run; here, Docker Optimised reaches the farthest values (~60 ms) once or twice, while the other containers and native tail off a bit sooner.
The middle of the distribution is the same; most container modes are minutely left-shifted under load (good), but the single worst outlier can come from any one mode depending on the run (including native).
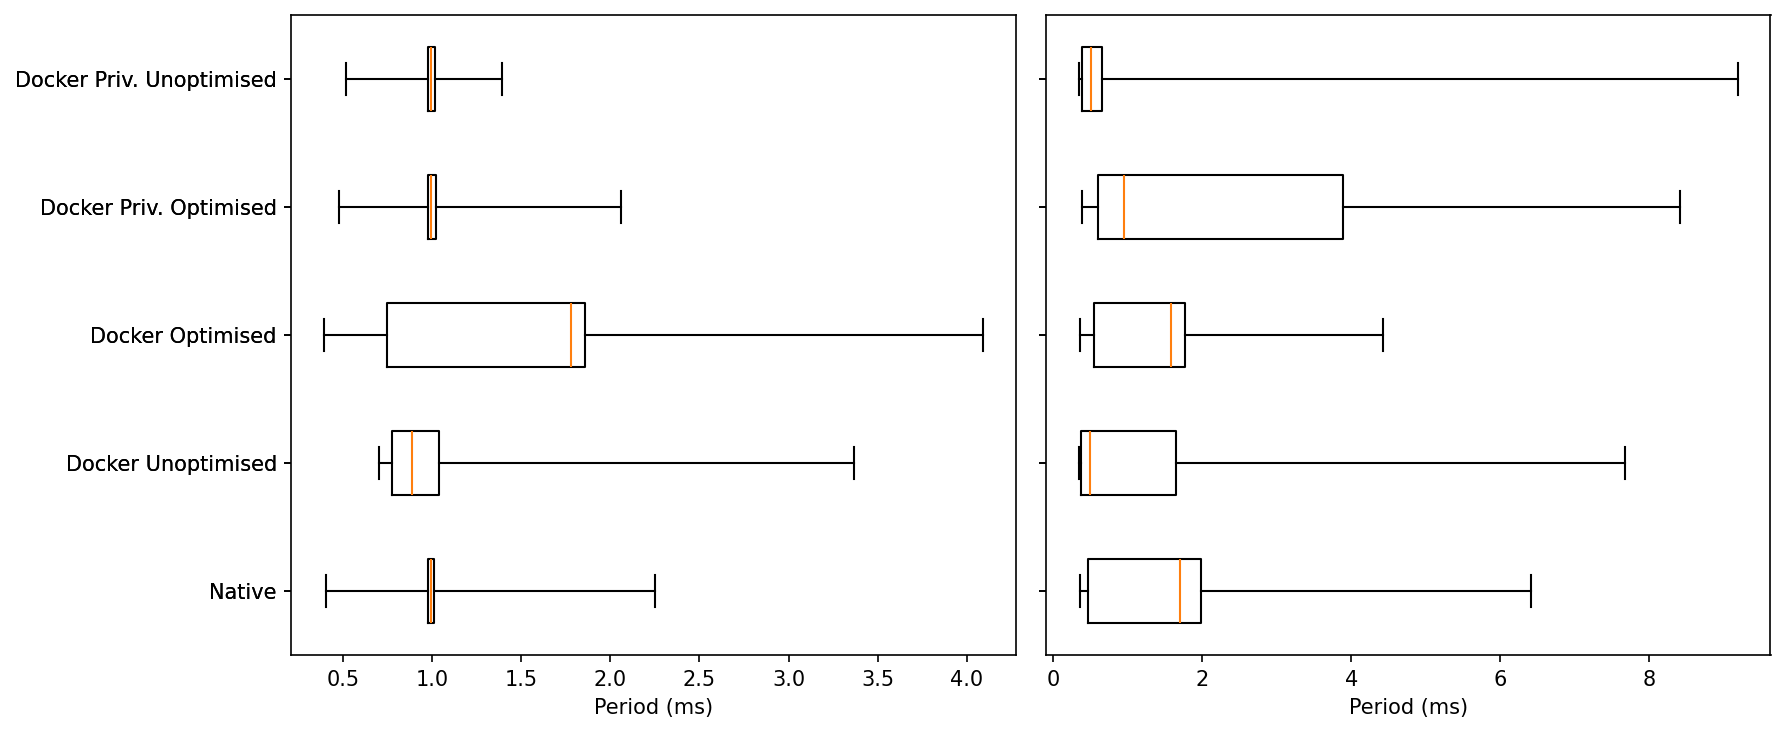
ROS Control Jitter
Idle: All five cluster around 1 ms. Typical whiskers:
Native / Docker Unoptimised / Privileged (both): maxs ~1.6–2.1 ms.
Docker Optimised: slightly wider whisker, brushing ~2.7–2.9 ms in this run
The Optimised profile trades a few more mid-tail events for the same median.
Load: Medians remain ~1 ms, but tails diverge:
Native: outliers ~2.5–3 ms.
Docker Unoptimised / Privileged Unoptimised: outliers ~8–9 ms.
Docker Privileged Optimised: rare outliers ~10–12 ms.
Docker Optimised: the longest tail this time, with a few points ~14 ms.
The more optimised we get, the more the extreme outliers grow. Among Docker modes, unoptimised tends to keep the shortest tail; optimised and privileged-optimised sometimes push higher extremes under heavy load.
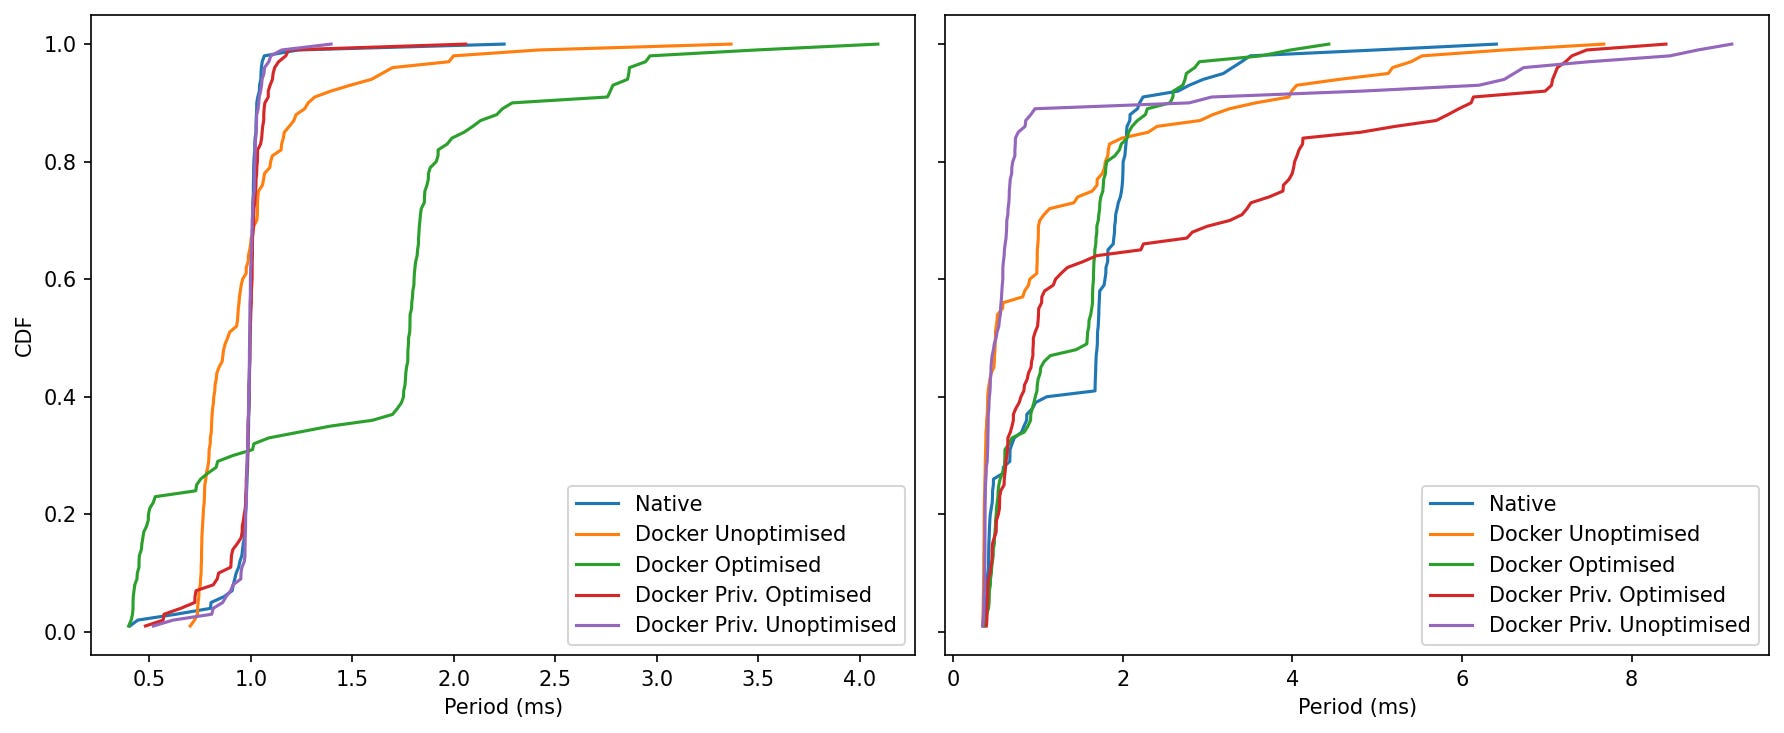
Idle: All five curves climb sharply at ~1 ms. Privileged Unoptimised and Privileged Optimised finish a touch earlier (shorter tails), Optimised has the fattest upper few percent (still <3 ms).
Load: Native rockets to ~99% by ~2.5 ms. Every Docker mode then spreads out: Unoptimised/Priv-Unopt trail off near 8–9 ms, Priv-Optimised near ~10–12 ms, Optimised near ~14 ms.
Bottom Line
At 0% CPU, all five modes meet a clean 1 kHz with nearly identical medians; Docker’s “Optimised” profile shows a slightly wider mid-tail. At 95% CPU, Native keeps the shortest tail, Docker Unoptimised and Privileged Unoptimised are next, and Optimised/Priv-Optimised occasionally reach the highest single-cycle outliers.
Jitter Benchmark with CPU pinning
The optimisations aren’t the problem; incomplete optimisation is. Let’s try the same benchmark with explicit CPU pinning for the ROS2 Control Container:
Idle:
All five modes sit right on 1.0 ms: medians overlap, with very tight boxes.
The one exception is Docker Optimised, which shows a noticeably wider upper whisker—a handful of idle hiccups pushing a few samples well above the pack. Everyone else has short whiskers and few outliers.
Under Load:
The central tendency stays close to target for all modes, but the tails separate:
Native keeps the shortest upper whisker and a compact inter-quartile range.
Docker Optimised is much improved versus earlier runs—tail capped around ~4–5 ms and a fairly tight box—so it’s close to Native on spread.
Docker Unoptimised and both Privileged variants carry the longest whiskers (isolated cycles in the ~7–9 ms region), i.e., the least predictable under pressure.
Idle:
The curves for Native, Docker Unoptimised and both Privileged modes are steep and left-shifted around 1.0 ms—> you almost always hit the target.
Docker Optimised climbs more slowly in the last few percent, confirming those occasional idle hiccups seen in the boxplot (rare but larger).
Under Load:
Native and Docker Optimised run neck-and-neck through most of the distribution (steep climb near ~1–2 ms), with Optimised now much closer on the last-percentile tail than before.
Docker Unoptimised lags slightly (curve sits to the right of Native/Optimised).
Privileged lines sit farthest right at the extreme percentiles—heavier tails, i.e., more frequent long single cycles.
Containers can hold a tight 1 kHz, but the winning recipe is SHM + host IPC plus explicit CPU pinning not privilege, and not a flat, unpinned cgroup. Pinning cores is a big step forward, but it’s not “done.” We’re close to native on median and most of the tail, yet a few long cycles remain—so there’s still headroom to tighten worst-case jitter:
Finer CPU pinning (separate executor vs. DDS threads; isolate IRQ cores).
Real-time policy per process/thread
DDS/SHM tuning: increase SHM segment & history depth only as needed; avoid oversized pools.
Kernel/OS: consider PREEMPT_RT or low-latency kernel; trim background daemons on the control cores.
MicroROS Throughput Benchmark
Effective Rate
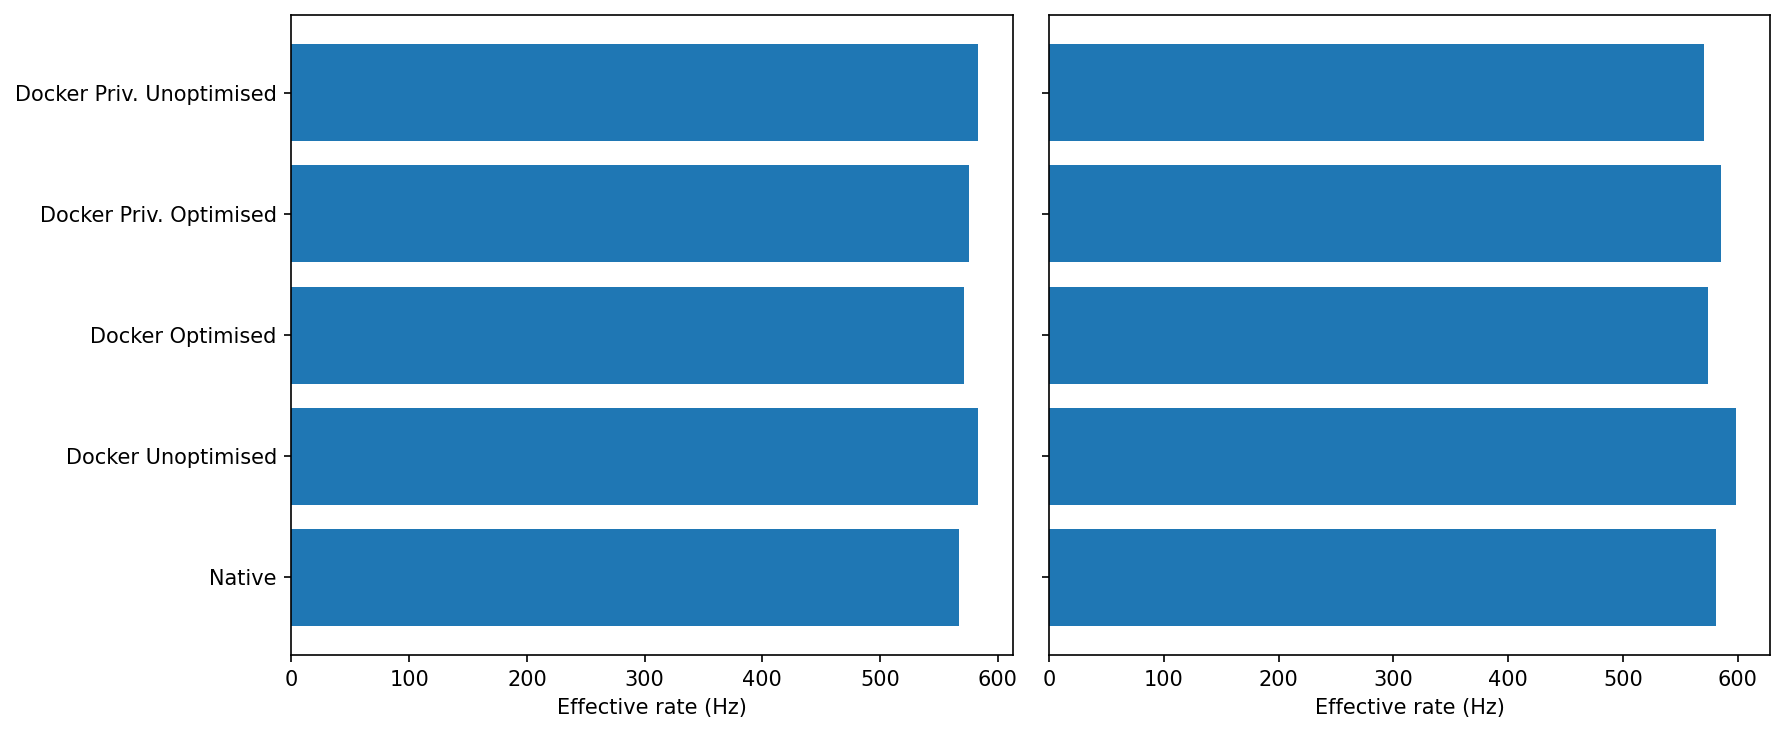
Idle: All five modes are within a couple of percent of each other (~580–600 Hz).
Loaded: Still clustered. Docker Unoptimised/Priv-Unoptimised tend to sit at the top end; Docker Optimised is occasionally a touch lower, but differences are small.
Sustained micro-ROS rate is robust across modes; there’s no meaningful “Docker tax” on throughput.
Period over time
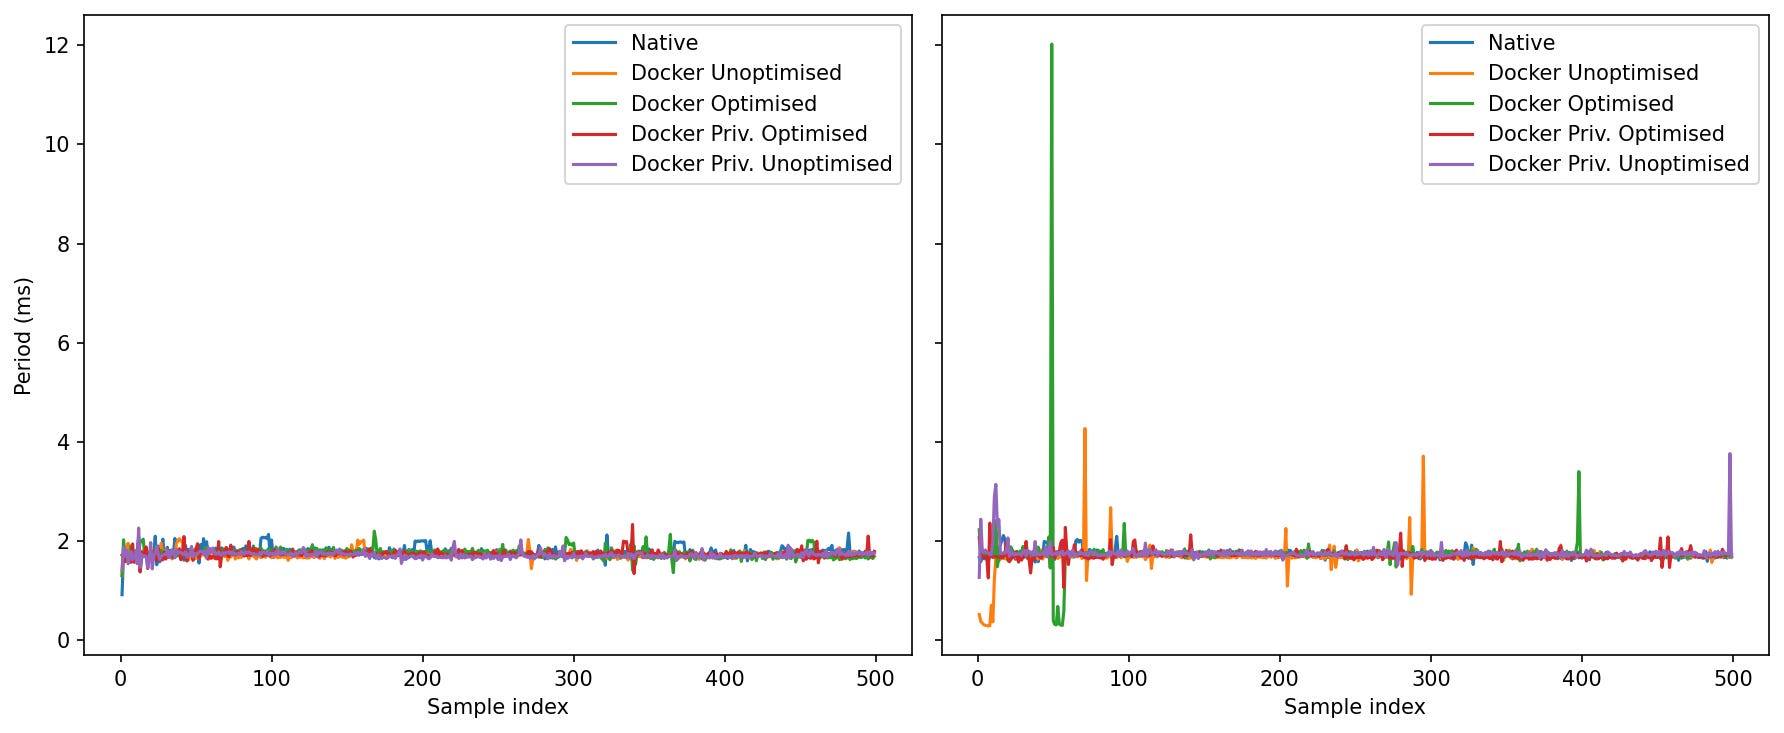
Idle: Everyone converges around ~1.7–1.8 ms; clean traces.
Loaded: This is where the modes separate by worst-case:
Native: spikes generally <~2.2 ms.
Docker Unoptimised/Priv-Unoptimised: mostly similar to Native, with occasional 3–4 ms blips.
Docker Optimised: exhibits the largest single outliers in your run (one early burst up to ~10–12 ms; a few late ~3–4 ms spikes).
Priv-Optimised: tails longer than Native but shorter than the largest “Optimised” spike.
Under stress, the tail risk depends on the docker profile. The “Optimised” knobs you used help with IPC/SHM and coordination, but don’t by themselves guarantee the smallest worst-case period.
Multi-container benchmarks
In real deployments, a ROS 2 system rarely ships as one big container. You often split the graph across multiple containers so each piece can be built, deployed, and monitored on its own.
That brings a bunch of practical wins:
Clear ownership & CI/CD: teams ship their node sets independently with versioned images and tests.
Dependency isolation: conflicting Python/C++/CUDA stacks don’t fight each other.
Failure isolation & hot restarts: one node crashes or restarts without taking the whole stack down.
Resource partitioning: pin CPU/memory per container; prioritize control over perception.
Flexible placement: run heavy nodes on a different host/SoC or GPU box without changing code.
The trade-off is communication: separate containers don’t share an IPC namespace by default, so intra-host traffic falls back to the network stack. In the next section I measure what that costs—looking at latency and throughput for single-container vs two-container setups on both bridge and host networking, at idle and under load.
Latency
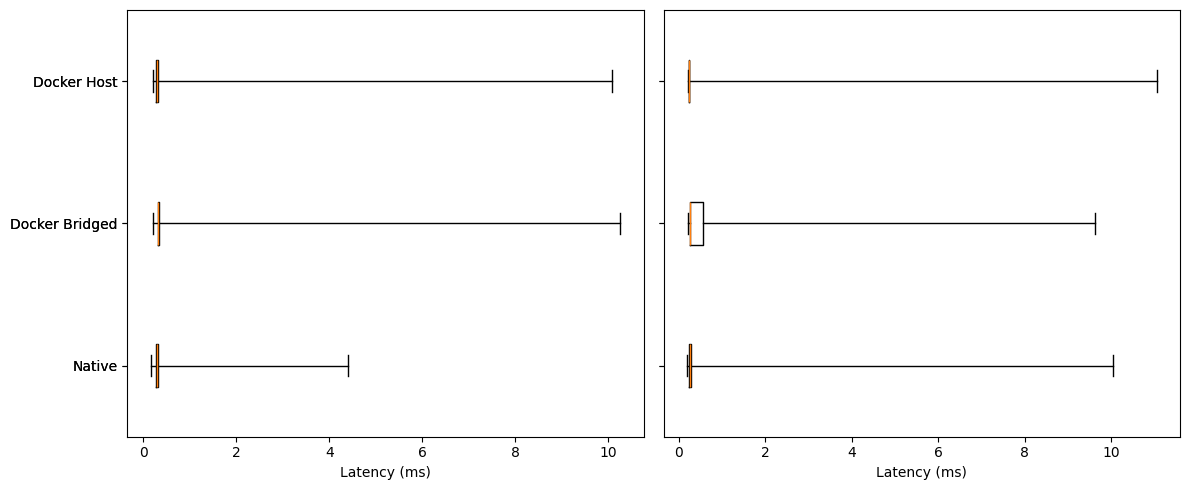
Idle:
All three modes have tiny boxes (very small IQR) with medians clustered ~0.25–0.35 ms.
Whiskers/outliers are the only real difference:
Native tops out around ~4 ms.
Docker Bridged/Host show rare long outliers up to ~10 ms.
Under Load:
Medians remain ~0.25–0.35 ms for all; the center didn’t move much.
Tails separate:
Docker Host shows the tightest middle (narrow box) and fewer mid-range excursions, though it still has occasional long spikes (~10–11 ms max).
Docker Bridged has a slightly wider box and mid-tail.
Native shows the most frequent multi-ms excursions in this run (several spikes, max ~10 ms).
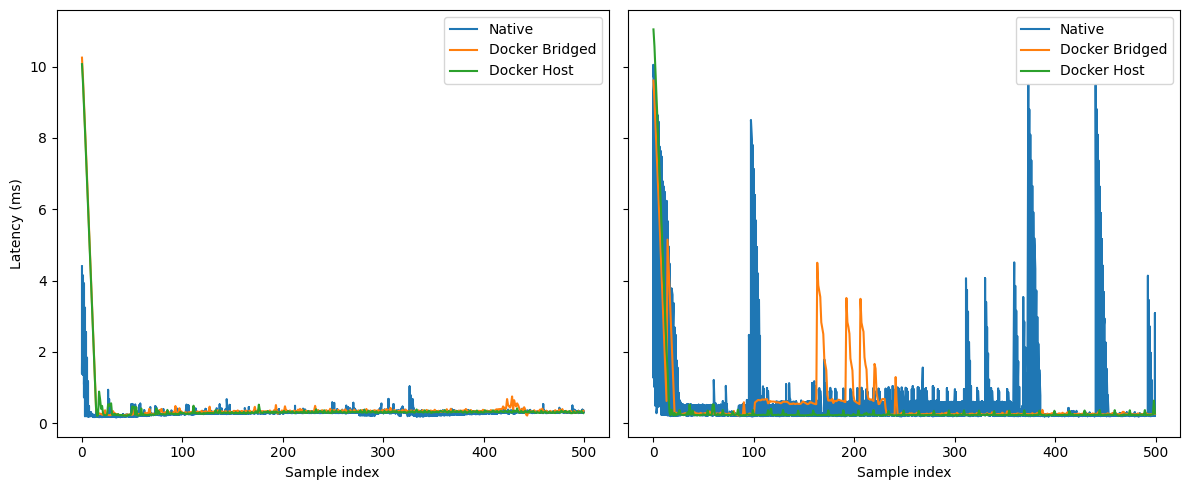
Idle:
All three settle to a ~0.25–0.35 ms baseline after the warm-up.
Sporadic blips: Native and Bridged show a few sub-ms bumps; Host is the quietest overall.
Under Load:
Native exhibits recurrent bursty spikes (many into the multi-ms range, a few near 8–10 ms).
Docker Bridged has clusters of 0.3–1 ms excursions with occasional 2–5 ms bursts (not as many as Native).
Docker Host is the flattest line; mostly sub-ms with only rare single-sample spikes.
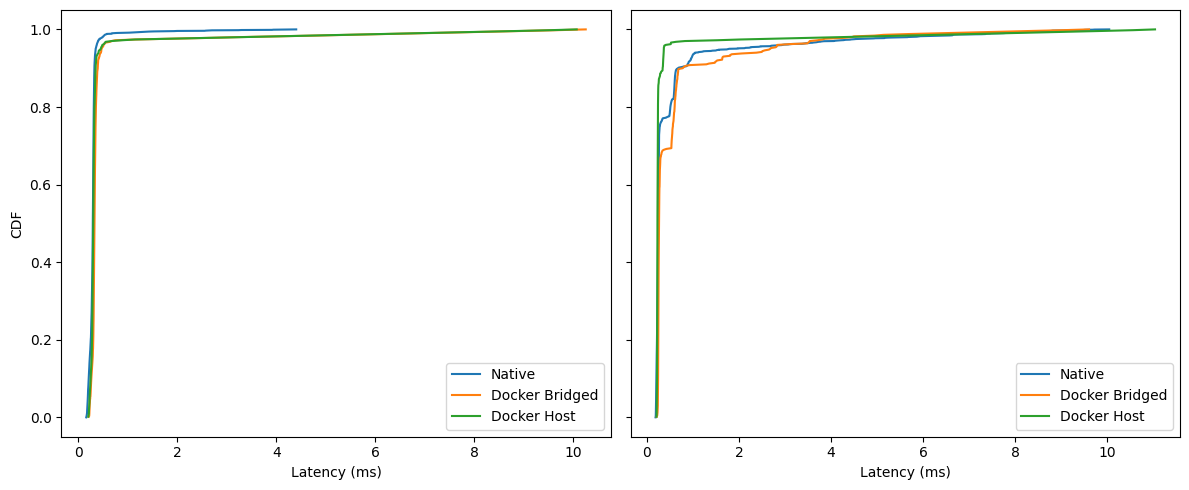
Idle:
For ~95% of samples, all three are under ~0.5–0.6 ms (the curves overlap closely).
Between the 95th–99th percentiles the ordering is subtle: Native leads by a hair, then Host, then Bridged.
Above the 99th, everyone carries a long but extremely sparse tail (up to ~10 ms).
Under Load:
Within the first millisecond, Docker Host is consistently ahead (steeper curve), i.e., more samples land <1 ms.
Docker Bridged trails Host slightly in the 90–99% region.
Native’s curve shows small shelves/plateaus in the sub-ms region (reflecting the bursts you see in the time-series), then catches up; all three still converge by ~10 ms.
Bottom Line:
Median behavior is essentially identical across modes—containerization and bridging don’t move the center at all.
Under load, determinism improves with
--network=host: host networking shows the tightest sub-ms distribution and the fewest multi-ms bursts. Bridged adds a little mid-tail overhead; Native in these runs shows the most frequent bursts.The remaining pain is in the extreme tail (rare 8–11 ms outliers) across all modes, and worse with Native. Those are almost certainly scheduler/NIC/IRQ related rather than Docker overhead.
Throughput
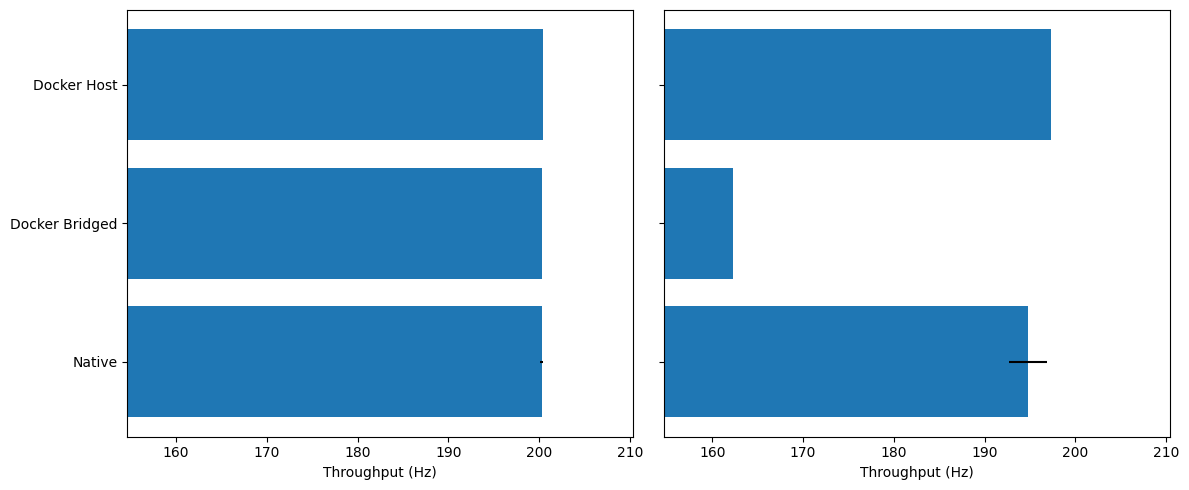
Idle: All three modes sit right around 200 Hz; differences are within noise.
Under Load: Docker (bridged) drops to ~162–165 Hz (≈−18–20% vs. Native/Host). Docker (host) stays essentially native-like (~196–198 Hz).
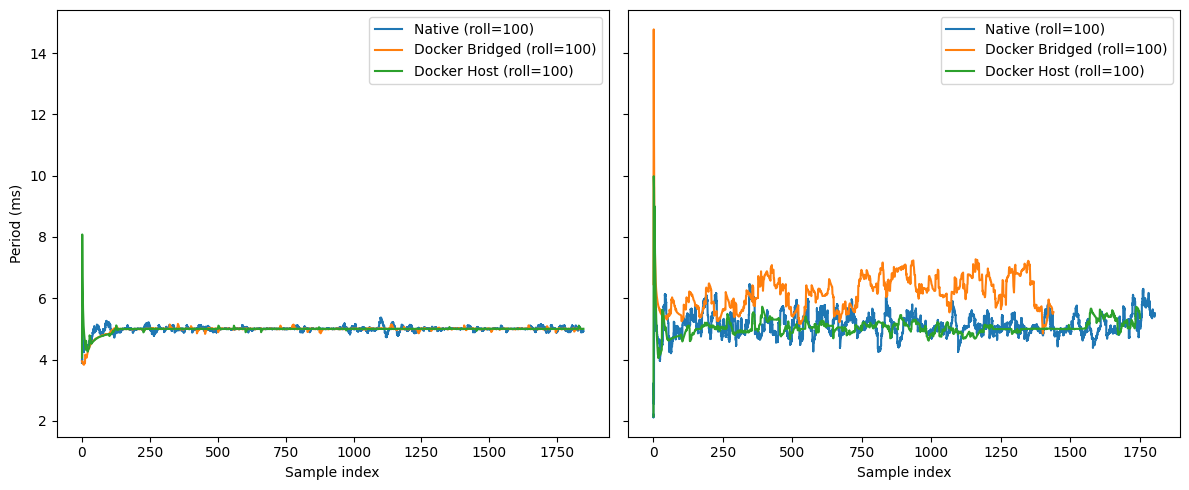
Idle: Everyone hugs 5 ms with small start-up blips; Host has one early spike, then settles.
Under Load: Low-frequency wander grows. Bridged shows the biggest drift (5–7 ms band) and more frequent excursions; Host tracks Native closely with smaller amplitude.
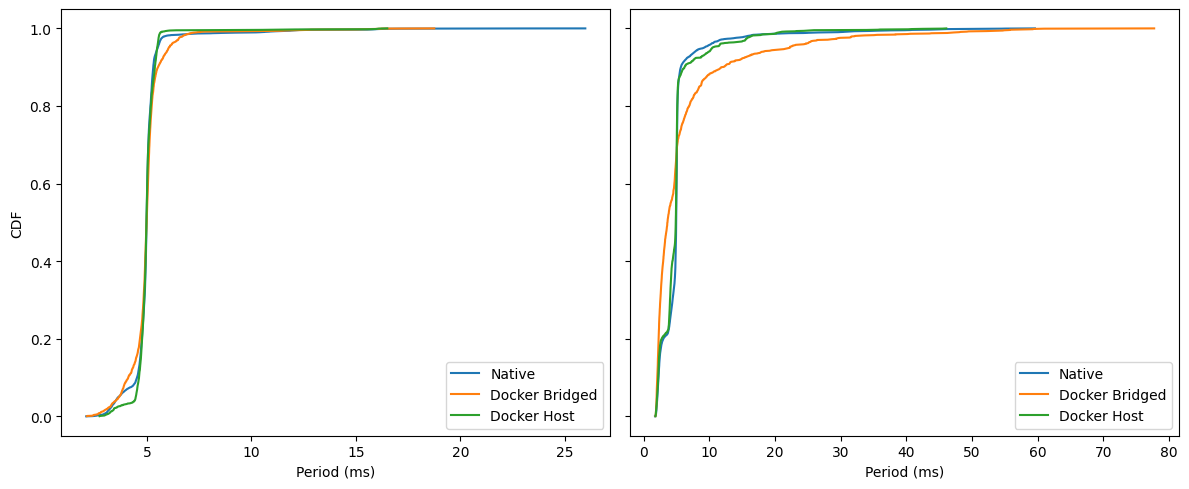
Idle: curves nearly overlap; ~99% of cycles finish by ≈6–7 ms. Bridged has a slightly fatter shoulder around 5–6 ms.
Under Load: separation is clear. By 10 ms, Host/Native are ~0.95–0.97, while Bridged lags (≈0.85–0.9). Worst-case tails: Native ~60 ms, Host ~48 ms, Bridged ~75–80 ms.
Conclusions
If you’ve made it to the end—nice work.
The headline is simple: containers don’t magically fix real-time, but when you treat them as boxes of cooperating processes and tune the box instead of every single PID, you get a system that’s easier to reason about and, on embedded targets, can run essentially neck-and-neck with native.
That “box” abstraction is the through-line of these results. With cgroups and namespaces wrapped around a set of processes, the scheduler often doles out a fairer and more stable share of CPU to a container than it would to the same processes running independently. That fairness is why several benchmarks don’t degrade—and in a few cases improve—once the machine is under real contention.
Across the plots the story repeats. At light load, native and Docker both meet their targets; under stress they converge.
“Docker kills real-time” is not borne out by the data. With cores isolated, priorities set, and memory policy applied, loop timing and throughput are on par with native execution. Nor is Docker a VM; there’s no hypervisor tax here—the scheduler and kernel are the same ones your native processes would use. Likewise, “privileged” or “optimised” as a blanket setting is not a speed potion. Without the right cpusets, IRQ affinity, and memory/IPC choices, those flags can even widen jitter tails by letting other work share the same cores or memory paths.
Methodology and scope
There are, of course, limits. These runs used synthetic load with a specific profile designed to stress timing; real deployments vary. Hardware matters too. I deliberately focused on an embedded system because that’s where teams struggle most, but on a beefy Core i9 workstation Docker actually edges native even in the jitter tests. I decided to not include those results for two reasons. One is that the article is large enough anyway, and the second is that it shows an ideal case. You probably won’t ship a 250W TDP CPU with your robot. Your mileage will follow your cores, clocks, and drivers.
Closing thought
Containers don’t magically speed up code, but they do give the kernel a clean unit to schedule. That “box” abstraction—paired with boring, well-understood RT hygiene—explains why the curves converge under pressure and why Docker often equals native when configured with intent.
And the wins aren’t just about timing. Containers bring a lot more advantagest:
Reproducible builds: pinned deps, identical images in dev/CI/robot.
Safe rollouts: OTA updates, canaries, instant rollbacks.
Clean dependency boundaries: CUDA/Python/C++ stacks don’t clash.
Fault isolation: a node can crash/restart without taking down the graph.
Team ownership: ship and test components independently.
Least-privilege security: targeted caps/devices instead of “run as root.”
Better observability: consistent logs/metrics around a known process group.
Portability: the same image runs on laptops, benches, and robots.
In short: even before you look at latency charts, containers make your robotics stack easier to build, ship, debug, and operate.
That circles back to the myths from the intro—“Docker is slow” “Real-time is impossible”, “Networking is worse.” The data here don’t support those claims.
With the box configured properly, we saw parity at idle and stability under load; in a few cases, the containerized runs were more predictable than native.
So the real question isn’t “can Docker do real-time?” It’s “will you configure the box?” When you do, you get the performance you expect plus reproducible workflows, reliable OTA, simpler ops, and a system that behaves the same in the lab as it does on the robot.
At robocore, we specialize in deploying robotics applications, from ROS/ROS 2 to micro-ROS, on embedded and edge hardware. We package your stack into containers, profile the hotspots, and apply the practical real-time settings—cpusets, IRQ isolation, scheduling policy, memory locking, and the right networking mode—so behaviour is repeatable from lab to robot. We also build CI benches that catch timing regressions before they ship. If you want containerized deployments without timing surprises, we can help.
Don’t hesitate to contact us via: